- Sweden
- /
- Specialty Stores
- /
- OM:SYNSAM
Synsam AB (publ) Just Missed EPS By 41%: Here's What Analysts Think Will Happen Next

The analysts might have been a bit too bullish on Synsam AB (publ) (STO:SYNSAM), given that the company fell short of expectations when it released its third-quarter results last week. Results showed a clear earnings miss, with kr1.6b revenue coming in 2.1% lower than what the analystsexpected. Statutory earnings per share (EPS) of kr0.44 missed the mark badly, arriving some 41% below what was expected. This is an important time for investors, as they can track a company's performance in its report, look at what experts are forecasting for next year, and see if there has been any change to expectations for the business. With this in mind, we've gathered the latest statutory forecasts to see what the analysts are expecting for next year.
See our latest analysis for Synsam

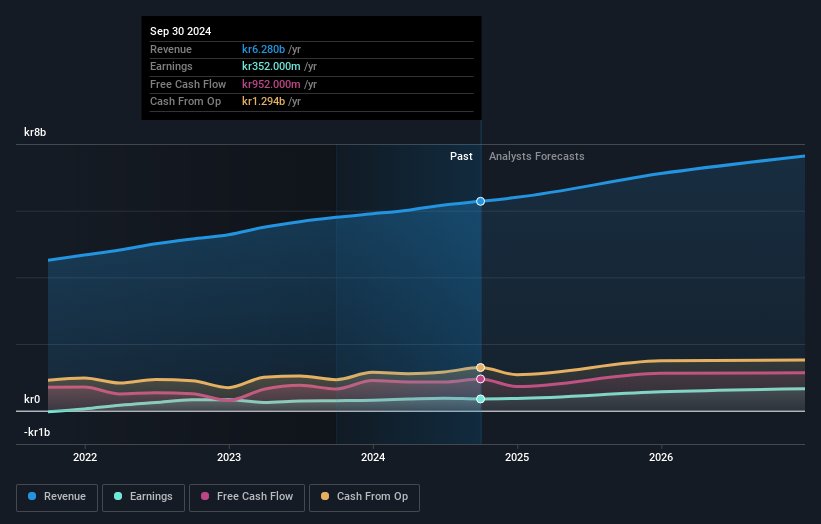
Taking into account the latest results, the consensus forecast from Synsam's four analysts is for revenues of kr7.11b in 2025. This reflects a solid 13% improvement in revenue compared to the last 12 months. Statutory earnings per share are predicted to leap 61% to kr3.83. Yet prior to the latest earnings, the analysts had been anticipated revenues of kr7.11b and earnings per share (EPS) of kr3.93 in 2025. So it looks like there's been a small decline in overall sentiment after the recent results - there's been no major change to revenue estimates, but the analysts did make a minor downgrade to their earnings per share forecasts.
It might be a surprise to learn that the consensus price target was broadly unchanged at kr64.00, with the analysts clearly implying that the forecast decline in earnings is not expected to have much of an impact on valuation. There's another way to think about price targets though, and that's to look at the range of price targets put forward by analysts, because a wide range of estimates could suggest a diverse view on possible outcomes for the business. The most optimistic Synsam analyst has a price target of kr65.00 per share, while the most pessimistic values it at kr62.00. The narrow spread of estimates could suggest that the business' future is relatively easy to value, or thatthe analysts have a strong view on its prospects.
Another way we can view these estimates is in the context of the bigger picture, such as how the forecasts stack up against past performance, and whether forecasts are more or less bullish relative to other companies in the industry. We can infer from the latest estimates that forecasts expect a continuation of Synsam'shistorical trends, as the 10% annualised revenue growth to the end of 2025 is roughly in line with the 12% annual growth over the past five years. Compare this with the broader industry, which analyst estimates (in aggregate) suggest will see revenues grow 4.3% annually. So although Synsam is expected to maintain its revenue growth rate, it's definitely expected to grow faster than the wider industry.
The Bottom Line
The biggest concern is that the analysts reduced their earnings per share estimates, suggesting business headwinds could lay ahead for Synsam. Fortunately, they also reconfirmed their revenue numbers, suggesting that it's tracking in line with expectations. Additionally, our data suggests that revenue is expected to grow faster than the wider industry. There was no real change to the consensus price target, suggesting that the intrinsic value of the business has not undergone any major changes with the latest estimates.
Following on from that line of thought, we think that the long-term prospects of the business are much more relevant than next year's earnings. We have forecasts for Synsam going out to 2026, and you can see them free on our platform here.
Plus, you should also learn about the 1 warning sign we've spotted with Synsam .
New: Manage All Your Stock Portfolios in One Place
We've created the ultimate portfolio companion for stock investors, and it's free.
• Connect an unlimited number of Portfolios and see your total in one currency
• Be alerted to new Warning Signs or Risks via email or mobile
• Track the Fair Value of your stocks
Have feedback on this article? Concerned about the content? Get in touch with us directly. Alternatively, email editorial-team (at) simplywallst.com.
This article by Simply Wall St is general in nature. We provide commentary based on historical data and analyst forecasts only using an unbiased methodology and our articles are not intended to be financial advice. It does not constitute a recommendation to buy or sell any stock, and does not take account of your objectives, or your financial situation. We aim to bring you long-term focused analysis driven by fundamental data. Note that our analysis may not factor in the latest price-sensitive company announcements or qualitative material. Simply Wall St has no position in any stocks mentioned.
About OM:SYNSAM
Synsam
Operates in the optical retail and eye health sector in the Nordic Region.
Undervalued with high growth potential.
Market Insights
Community Narratives


