
Advertisement
- Sweden
- /
- Specialty Stores
- /
- OM:NELLY
Nelly Group (STO:NELLY) Shareholders Received A Total Return Of Negative 29% In The Last Three Years
Many investors define successful investing as beating the market average over the long term. But if you try your hand at stock picking, your risk returning less than the market. We regret to report that long term Nelly Group AB (publ) (STO:NELLY) shareholders have had that experience, with the share price dropping 81% in three years, versus a market return of about 41%. Shareholders have had an even rougher run lately, with the share price down 62% in the last 90 days.
We really feel for shareholders in this scenario. It's a good reminder of the importance of diversification, and it's worth keeping in mind there's more to life than money, anyway.
View our latest analysis for Nelly Group
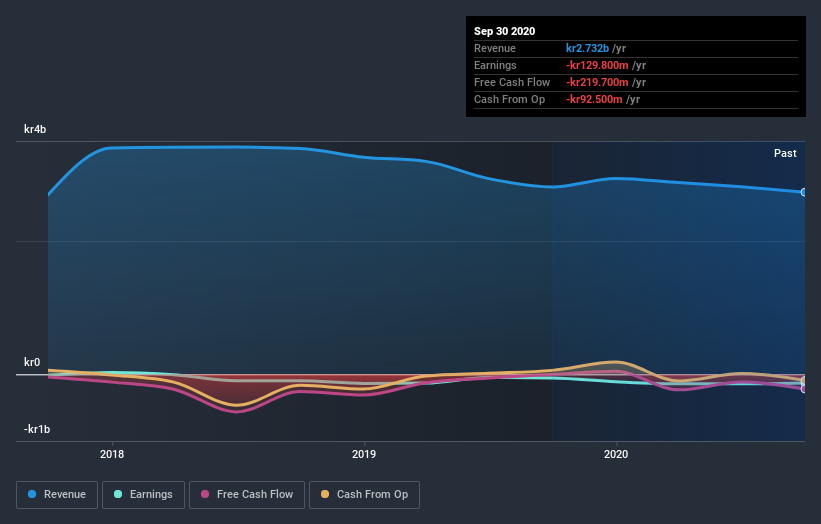
Nelly Group isn't currently profitable, so most analysts would look to revenue growth to get an idea of how fast the underlying business is growing. When a company doesn't make profits, we'd generally expect to see good revenue growth. That's because fast revenue growth can be easily extrapolated to forecast profits, often of considerable size.
Over the last three years, Nelly Group's revenue dropped 5.5% per year. That's not what investors generally want to see. Having said that the 22% annualized share price decline highlights the risk of investing in unprofitable companies. We're generally averse to companies with declining revenues, but we're not alone in that. Don't let a share price decline ruin your calm. You make better decisions when you're calm.
The image below shows how earnings and revenue have tracked over time (if you click on the image you can see greater detail).
We consider it positive that insiders have made significant purchases in the last year. Having said that, most people consider earnings and revenue growth trends to be a more meaningful guide to the business. Before buying or selling a stock, we always recommend a close examination of historic growth trends, available here..
What about the Total Shareholder Return (TSR)?
We've already covered Nelly Group's share price action, but we should also mention its total shareholder return (TSR). Arguably the TSR is a more complete return calculation because it accounts for the value of dividends (as if they were reinvested), along with the hypothetical value of any discounted capital that have been offered to shareholders. Nelly Group's TSR of was a loss of 29% for the 3 years. That wasn't as bad as its share price return, because it has paid dividends.
A Different Perspective
It's good to see that Nelly Group has rewarded shareholders with a total shareholder return of 94% in the last twelve months. That gain is better than the annual TSR over five years, which is 1.6%. Therefore it seems like sentiment around the company has been positive lately. Someone with an optimistic perspective could view the recent improvement in TSR as indicating that the business itself is getting better with time. It's always interesting to track share price performance over the longer term. But to understand Nelly Group better, we need to consider many other factors. Like risks, for instance. Every company has them, and we've spotted 5 warning signs for Nelly Group (of which 2 are a bit concerning!) you should know about.
There are plenty of other companies that have insiders buying up shares. You probably do not want to miss this free list of growing companies that insiders are buying.
Please note, the market returns quoted in this article reflect the market weighted average returns of stocks that currently trade on SE exchanges.
If you’re looking to trade Nelly Group, open an account with the lowest-cost* platform trusted by professionals, Interactive Brokers. Their clients from over 200 countries and territories trade stocks, options, futures, forex, bonds and funds worldwide from a single integrated account. Promoted
Valuation is complex, but we're here to simplify it.
Discover if Nelly Group might be undervalued or overvalued with our detailed analysis, featuring fair value estimates, potential risks, dividends, insider trades, and its financial condition.
Access Free AnalysisThis article by Simply Wall St is general in nature. It does not constitute a recommendation to buy or sell any stock, and does not take account of your objectives, or your financial situation. We aim to bring you long-term focused analysis driven by fundamental data. Note that our analysis may not factor in the latest price-sensitive company announcements or qualitative material. Simply Wall St has no position in any stocks mentioned.
*Interactive Brokers Rated Lowest Cost Broker by StockBrokers.com Annual Online Review 2020
Have feedback on this article? Concerned about the content? Get in touch with us directly. Alternatively, email editorial-team@simplywallst.com.
About OM:NELLY
Nelly Group
Operates as a fashion company in Sweden, rest of Nordics, and internationally.
Flawless balance sheet with solid track record.
Market Insights

Advertisement
Community Narratives
The company that turned a verb into a global necessity and basically runs the modern internet, digital ads, smartphones, maps, and AI.
Fair Value US$300.00|6.3% undervalued
OS
Community Contributor
Flowers Foods Pays A Fair Price For Health
Fair Value US$16.12|26.0% undervalued
NV
Community Contributor
TMX Group will thrive with 33.3% profit margin and enduring market moat
Fair Value CA$49.90|3.7% overvalued
LI
Community Contributor