
Advertisement
- Sweden
- /
- Specialty Stores
- /
- OM:HM B
A Look At The Fair Value Of H & M Hennes & Mauritz AB (publ) (STO:HM B)
Key Insights
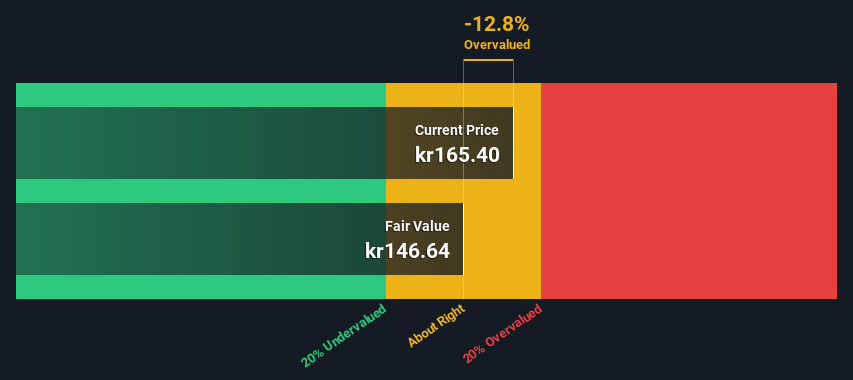
- H & M Hennes & Mauritz's estimated fair value is kr147 based on 2 Stage Free Cash Flow to Equity
- With kr165 share price, H & M Hennes & Mauritz appears to be trading close to its estimated fair value
- Analyst price target for HM B is kr170, which is 16% above our fair value estimate
Does the September share price for H & M Hennes & Mauritz AB (publ) (STO:HM B) reflect what it's really worth? Today, we will estimate the stock's intrinsic value by taking the expected future cash flows and discounting them to their present value. The Discounted Cash Flow (DCF) model is the tool we will apply to do this. Before you think you won't be able to understand it, just read on! It's actually much less complex than you'd imagine.
Companies can be valued in a lot of ways, so we would point out that a DCF is not perfect for every situation. Anyone interested in learning a bit more about intrinsic value should have a read of the Simply Wall St analysis model.
See our latest analysis for H & M Hennes & Mauritz
The Calculation
We are going to use a two-stage DCF model, which, as the name states, takes into account two stages of growth. The first stage is generally a higher growth period which levels off heading towards the terminal value, captured in the second 'steady growth' period. To begin with, we have to get estimates of the next ten years of cash flows. Where possible we use analyst estimates, but when these aren't available we extrapolate the previous free cash flow (FCF) from the last estimate or reported value. We assume companies with shrinking free cash flow will slow their rate of shrinkage, and that companies with growing free cash flow will see their growth rate slow, over this period. We do this to reflect that growth tends to slow more in the early years than it does in later years.
Generally we assume that a dollar today is more valuable than a dollar in the future, so we need to discount the sum of these future cash flows to arrive at a present value estimate:
10-year free cash flow (FCF) forecast
| 2025 | 2026 | 2027 | 2028 | 2029 | 2030 | 2031 | 2032 | 2033 | 2034 | |
| Levered FCF (SEK, Millions) | kr19.4b | kr16.1b | kr14.2b | kr13.0b | kr12.4b | kr11.9b | kr11.7b | kr11.6b | kr11.5b | kr11.5b |
| Growth Rate Estimate Source | Analyst x6 | Analyst x4 | Est @ -11.79% | Est @ -7.93% | Est @ -5.22% | Est @ -3.33% | Est @ -2.01% | Est @ -1.08% | Est @ -0.43% | Est @ 0.02% |
| Present Value (SEK, Millions) Discounted @ 5.9% | kr18.3k | kr14.3k | kr11.9k | kr10.4k | kr9.3k | kr8.5k | kr7.8k | kr7.3k | kr6.9k | kr6.5k |
("Est" = FCF growth rate estimated by Simply Wall St)
Present Value of 10-year Cash Flow (PVCF) = kr101b
The second stage is also known as Terminal Value, this is the business's cash flow after the first stage. For a number of reasons a very conservative growth rate is used that cannot exceed that of a country's GDP growth. In this case we have used the 5-year average of the 10-year government bond yield (1.1%) to estimate future growth. In the same way as with the 10-year 'growth' period, we discount future cash flows to today's value, using a cost of equity of 5.9%.
Terminal Value (TV)= FCF2034 × (1 + g) ÷ (r – g) = kr12b× (1 + 1.1%) ÷ (5.9%– 1.1%) = kr240b
Present Value of Terminal Value (PVTV)= TV / (1 + r)10= kr240b÷ ( 1 + 5.9%)10= kr135b
The total value, or equity value, is then the sum of the present value of the future cash flows, which in this case is kr236b. In the final step we divide the equity value by the number of shares outstanding. Compared to the current share price of kr165, the company appears around fair value at the time of writing. Valuations are imprecise instruments though, rather like a telescope - move a few degrees and end up in a different galaxy. Do keep this in mind.
The Assumptions
We would point out that the most important inputs to a discounted cash flow are the discount rate and of course the actual cash flows. Part of investing is coming up with your own evaluation of a company's future performance, so try the calculation yourself and check your own assumptions. The DCF also does not consider the possible cyclicality of an industry, or a company's future capital requirements, so it does not give a full picture of a company's potential performance. Given that we are looking at H & M Hennes & Mauritz as potential shareholders, the cost of equity is used as the discount rate, rather than the cost of capital (or weighted average cost of capital, WACC) which accounts for debt. In this calculation we've used 5.9%, which is based on a levered beta of 1.177. Beta is a measure of a stock's volatility, compared to the market as a whole. We get our beta from the industry average beta of globally comparable companies, with an imposed limit between 0.8 and 2.0, which is a reasonable range for a stable business.
SWOT Analysis for H & M Hennes & Mauritz
Strength
- Earnings growth over the past year exceeded the industry.
- Debt is not viewed as a risk.
Weakness
- Dividend is low compared to the top 25% of dividend payers in the Specialty Retail market.
Opportunity
- Annual revenue is forecast to grow faster than the Swedish market.
- Good value based on P/E ratio compared to estimated Fair P/E ratio.
Threat
- Dividends are not covered by earnings.
- Annual earnings are forecast to grow slower than the Swedish market.
Looking Ahead:
Although the valuation of a company is important, it is only one of many factors that you need to assess for a company. It's not possible to obtain a foolproof valuation with a DCF model. Preferably you'd apply different cases and assumptions and see how they would impact the company's valuation. For instance, if the terminal value growth rate is adjusted slightly, it can dramatically alter the overall result. For H & M Hennes & Mauritz, we've compiled three pertinent aspects you should assess:
- Risks: Be aware that H & M Hennes & Mauritz is showing 1 warning sign in our investment analysis , you should know about...
- Management:Have insiders been ramping up their shares to take advantage of the market's sentiment for HM B's future outlook? Check out our management and board analysis with insights on CEO compensation and governance factors.
- Other Solid Businesses: Low debt, high returns on equity and good past performance are fundamental to a strong business. Why not explore our interactive list of stocks with solid business fundamentals to see if there are other companies you may not have considered!
PS. Simply Wall St updates its DCF calculation for every Swedish stock every day, so if you want to find the intrinsic value of any other stock just search here.
Valuation is complex, but we're here to simplify it.
Discover if H & M Hennes & Mauritz might be undervalued or overvalued with our detailed analysis, featuring fair value estimates, potential risks, dividends, insider trades, and its financial condition.
Access Free AnalysisHave feedback on this article? Concerned about the content? Get in touch with us directly. Alternatively, email editorial-team (at) simplywallst.com.
This article by Simply Wall St is general in nature. We provide commentary based on historical data and analyst forecasts only using an unbiased methodology and our articles are not intended to be financial advice. It does not constitute a recommendation to buy or sell any stock, and does not take account of your objectives, or your financial situation. We aim to bring you long-term focused analysis driven by fundamental data. Note that our analysis may not factor in the latest price-sensitive company announcements or qualitative material. Simply Wall St has no position in any stocks mentioned.
About OM:HM B
H & M Hennes & Mauritz
Provides clothing, accessories, footwear, cosmetics, home textiles, and homeware for women, men, and children worldwide.
Excellent balance sheet and fair value.
Similar Companies
Market Insights


Advertisement
Community Narratives
100% Patient Improvement in trial puts this $16M Biotech on the radar
Fair Value US$5.30|74.9% undervalued
JO
Community Contributor
PayPal's Future Growth Through Venmo and Merchant Solutions
Fair Value US$105.25|33.8% undervalued
ZW
Community Contributor
IREN's Bold Moves in Sustainable Bitcoin Mining & AI Data Centers
Fair Value US$26.54|6.3% overvalued
BL
Community Contributor