Here's Why We're Not Too Worried About Cantargia's (STO:CANTA) Cash Burn Situation


There's no doubt that money can be made by owning shares of unprofitable businesses. For example, although Amazon.com made losses for many years after listing, if you had bought and held the shares since 1999, you would have made a fortune. But while history lauds those rare successes, those that fail are often forgotten; who remembers Pets.com?
So, the natural question for Cantargia (STO:CANTA) shareholders is whether they should be concerned by its rate of cash burn. For the purposes of this article, cash burn is the annual rate at which an unprofitable company spends cash to fund its growth; its negative free cash flow. We'll start by comparing its cash burn with its cash reserves in order to calculate its cash runway.
See our latest analysis for Cantargia
When Might Cantargia Run Out Of Money?
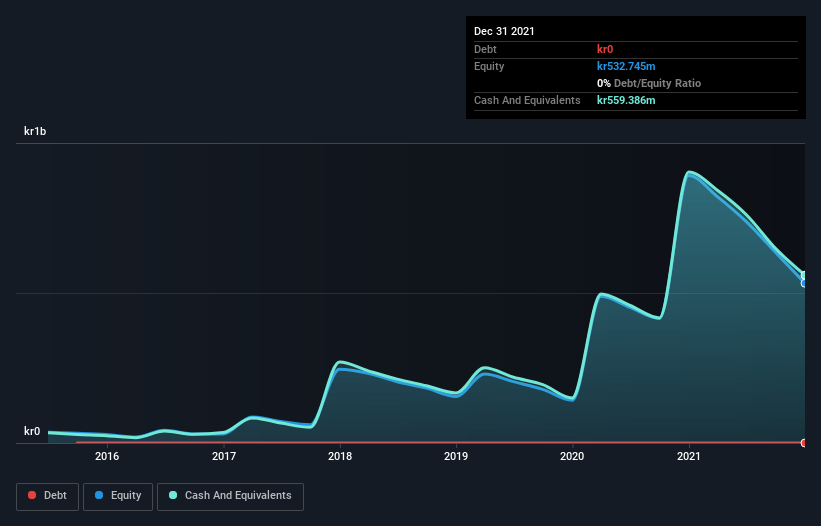
You can calculate a company's cash runway by dividing the amount of cash it has by the rate at which it is spending that cash. When Cantargia last reported its balance sheet in December 2021, it had zero debt and cash worth kr559m. Looking at the last year, the company burnt through kr347m. Therefore, from December 2021 it had roughly 19 months of cash runway. Importantly, though, analysts think that Cantargia will reach cashflow breakeven before then. In that case, it may never reach the end of its cash runway. Depicted below, you can see how its cash holdings have changed over time.
How Is Cantargia's Cash Burn Changing Over Time?
Because Cantargia isn't currently generating revenue, we consider it an early-stage business. So while we can't look to sales to understand growth, we can look at how the cash burn is changing to understand how expenditure is trending over time. The skyrocketing cash burn up 110% year on year certainly tests our nerves. That sort of spending growth rate can't continue for very long before it causes balance sheet weakness, generally speaking. Clearly, however, the crucial factor is whether the company will grow its business going forward. For that reason, it makes a lot of sense to take a look at our analyst forecasts for the company.
How Hard Would It Be For Cantargia To Raise More Cash For Growth?
Given its cash burn trajectory, Cantargia shareholders may wish to consider how easily it could raise more cash, despite its solid cash runway. Companies can raise capital through either debt or equity. Many companies end up issuing new shares to fund future growth. By comparing a company's annual cash burn to its total market capitalisation, we can estimate roughly how many shares it would have to issue in order to run the company for another year (at the same burn rate).
Since it has a market capitalisation of kr1.4b, Cantargia's kr347m in cash burn equates to about 25% of its market value. That's not insignificant, and if the company had to sell enough shares to fund another year's growth at the current share price, you'd likely witness fairly costly dilution.
So, Should We Worry About Cantargia's Cash Burn?
On this analysis of Cantargia's cash burn, we think its cash runway was reassuring, while its increasing cash burn has us a bit worried. There's no doubt that shareholders can take a lot of heart from the fact that analysts are forecasting it will reach breakeven before too long. Considering all the factors discussed in this article, we're not overly concerned about the company's cash burn, although we do think shareholders should keep an eye on how it develops. Separately, we looked at different risks affecting the company and spotted 2 warning signs for Cantargia (of which 1 is concerning!) you should know about.
Of course Cantargia may not be the best stock to buy. So you may wish to see this free collection of companies boasting high return on equity, or this list of stocks that insiders are buying.
New: AI Stock Screener & Alerts
Our new AI Stock Screener scans the market every day to uncover opportunities.
• Dividend Powerhouses (3%+ Yield)
• Undervalued Small Caps with Insider Buying
• High growth Tech and AI Companies
Or build your own from over 50 metrics.
Have feedback on this article? Concerned about the content? Get in touch with us directly. Alternatively, email editorial-team (at) simplywallst.com.
This article by Simply Wall St is general in nature. We provide commentary based on historical data and analyst forecasts only using an unbiased methodology and our articles are not intended to be financial advice. It does not constitute a recommendation to buy or sell any stock, and does not take account of your objectives, or your financial situation. We aim to bring you long-term focused analysis driven by fundamental data. Note that our analysis may not factor in the latest price-sensitive company announcements or qualitative material. Simply Wall St has no position in any stocks mentioned.
About OM:CANTA
Cantargia
A biotechnology company, develops antibody-based treatments for life threatening diseases.
Flawless balance sheet moderate.
