
Advertisement
- Sweden
- /
- Entertainment
- /
- OM:MAGI
MAG Interactive AB (publ)'s (STO:MAGI) 28% Dip Still Leaving Some Shareholders Feeling Restless Over Its P/SRatio
MAG Interactive AB (publ) (STO:MAGI) shareholders won't be pleased to see that the share price has had a very rough month, dropping 28% and undoing the prior period's positive performance. Still, a bad month hasn't completely ruined the past year with the stock gaining 30%, which is great even in a bull market.
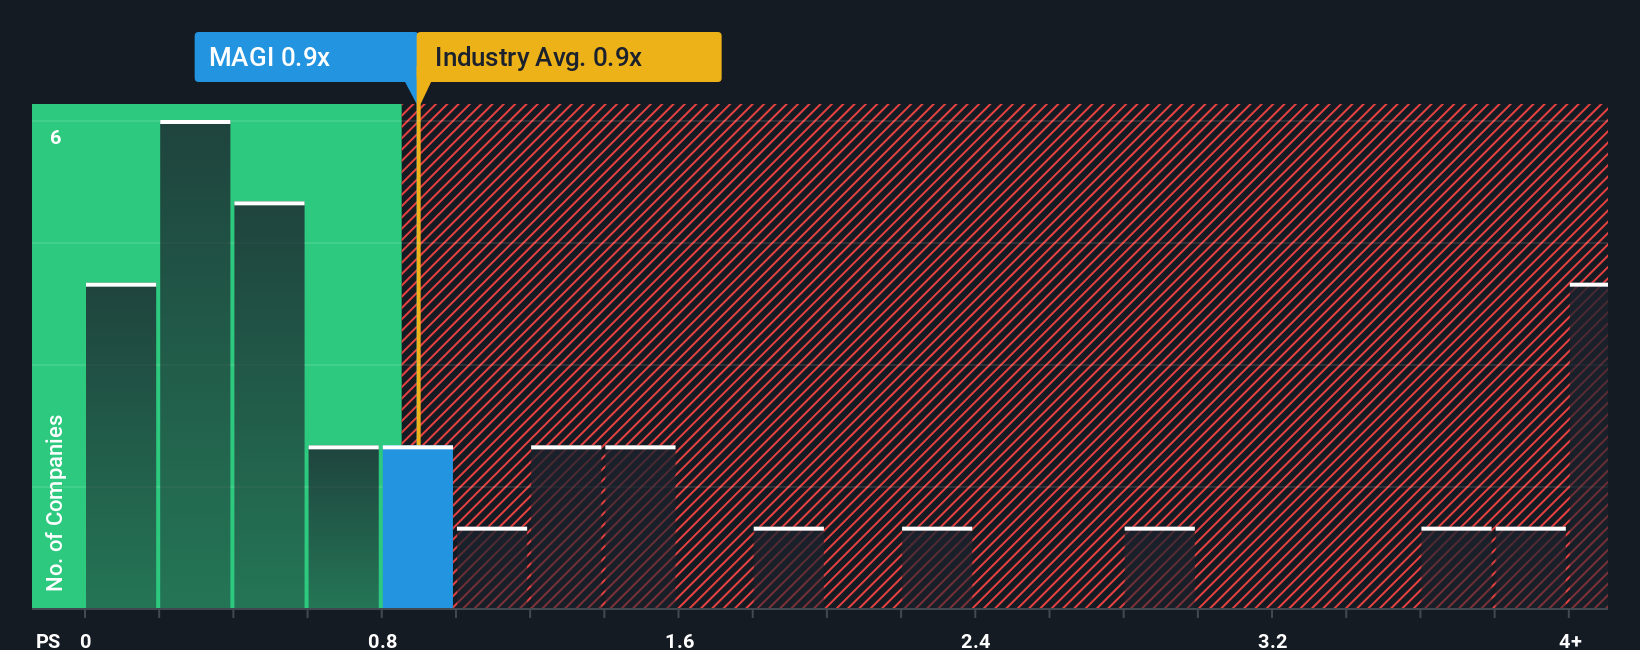
Although its price has dipped substantially, it's still not a stretch to say that MAG Interactive's price-to-sales (or "P/S") ratio of 0.9x right now seems quite "middle-of-the-road" compared to the Entertainment industry in Sweden, seeing as it matches the P/S ratio of the wider industry. However, investors might be overlooking a clear opportunity or potential setback if there is no rational basis for the P/S.
View our latest analysis for MAG Interactive
What Does MAG Interactive's Recent Performance Look Like?
For example, consider that MAG Interactive's financial performance has been poor lately as its revenue has been in decline. It might be that many expect the company to put the disappointing revenue performance behind them over the coming period, which has kept the P/S from falling. If not, then existing shareholders may be a little nervous about the viability of the share price.
We don't have analyst forecasts, but you can see how recent trends are setting up the company for the future by checking out our free report on MAG Interactive's earnings, revenue and cash flow.Is There Some Revenue Growth Forecasted For MAG Interactive?
There's an inherent assumption that a company should be matching the industry for P/S ratios like MAG Interactive's to be considered reasonable.
Retrospectively, the last year delivered a frustrating 7.7% decrease to the company's top line. This means it has also seen a slide in revenue over the longer-term as revenue is down 7.8% in total over the last three years. So unfortunately, we have to acknowledge that the company has not done a great job of growing revenue over that time.
In contrast to the company, the rest of the industry is expected to grow by 20% over the next year, which really puts the company's recent medium-term revenue decline into perspective.
In light of this, it's somewhat alarming that MAG Interactive's P/S sits in line with the majority of other companies. It seems most investors are ignoring the recent poor growth rate and are hoping for a turnaround in the company's business prospects. There's a good chance existing shareholders are setting themselves up for future disappointment if the P/S falls to levels more in line with the recent negative growth rates.
What Does MAG Interactive's P/S Mean For Investors?
Following MAG Interactive's share price tumble, its P/S is just clinging on to the industry median P/S. Generally, our preference is to limit the use of the price-to-sales ratio to establishing what the market thinks about the overall health of a company.
Our look at MAG Interactive revealed its shrinking revenues over the medium-term haven't impacted the P/S as much as we anticipated, given the industry is set to grow. When we see revenue heading backwards in the context of growing industry forecasts, it'd make sense to expect a possible share price decline on the horizon, sending the moderate P/S lower. Unless the the circumstances surrounding the recent medium-term improve, it wouldn't be wrong to expect a a difficult period ahead for the company's shareholders.
Having said that, be aware MAG Interactive is showing 4 warning signs in our investment analysis, and 1 of those is a bit unpleasant.
If these risks are making you reconsider your opinion on MAG Interactive, explore our interactive list of high quality stocks to get an idea of what else is out there.
New: Manage All Your Stock Portfolios in One Place
We've created the ultimate portfolio companion for stock investors, and it's free.
• Connect an unlimited number of Portfolios and see your total in one currency
• Be alerted to new Warning Signs or Risks via email or mobile
• Track the Fair Value of your stocks
Have feedback on this article? Concerned about the content? Get in touch with us directly. Alternatively, email editorial-team (at) simplywallst.com.
This article by Simply Wall St is general in nature. We provide commentary based on historical data and analyst forecasts only using an unbiased methodology and our articles are not intended to be financial advice. It does not constitute a recommendation to buy or sell any stock, and does not take account of your objectives, or your financial situation. We aim to bring you long-term focused analysis driven by fundamental data. Note that our analysis may not factor in the latest price-sensitive company announcements or qualitative material. Simply Wall St has no position in any stocks mentioned.
About OM:MAGI
Flawless balance sheet with very low risk.
Similar Companies
Market Insights

Advertisement
Community Narratives
MicroVision will explode future revenue by 380.37% with a vision towards success
Fair Value US$60.00|98.5% undervalued
TH
Community Contributor
The Indispensable Artery for a New North American Economy
Fair Value CA$132.87|2.3% undervalued
TI
Community Contributor