
Some say volatility, rather than debt, is the best way to think about risk as an investor, but Warren Buffett famously said that 'Volatility is far from synonymous with risk.' So it seems the smart money knows that debt - which is usually involved in bankruptcies - is a very important factor, when you assess how risky a company is. We note that SSAB AB (publ) (STO:SSAB A) does have debt on its balance sheet. But is this debt a concern to shareholders?
What Risk Does Debt Bring?
Debt and other liabilities become risky for a business when it cannot easily fulfill those obligations, either with free cash flow or by raising capital at an attractive price. Ultimately, if the company can't fulfill its legal obligations to repay debt, shareholders could walk away with nothing. While that is not too common, we often do see indebted companies permanently diluting shareholders because lenders force them to raise capital at a distressed price. Having said that, the most common situation is where a company manages its debt reasonably well - and to its own advantage. The first step when considering a company's debt levels is to consider its cash and debt together.
See our latest analysis for SSAB
What Is SSAB's Debt?
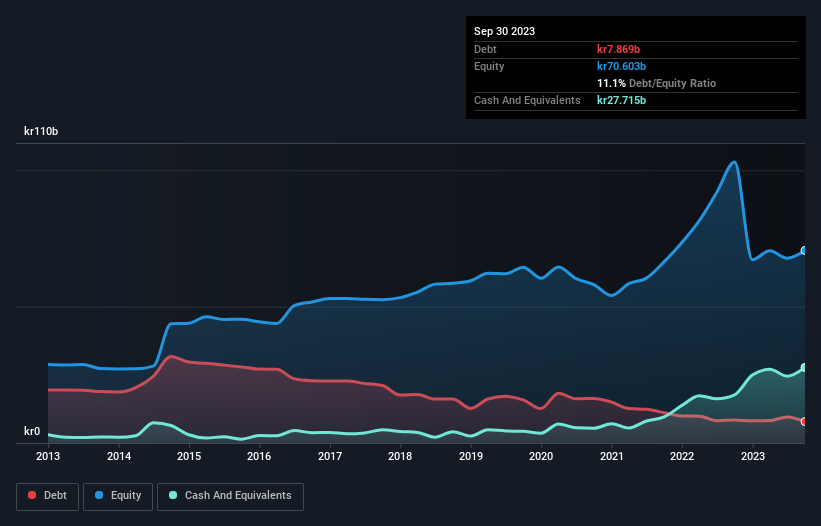
You can click the graphic below for the historical numbers, but it shows that SSAB had kr7.87b of debt in September 2023, down from kr8.39b, one year before. However, its balance sheet shows it holds kr27.7b in cash, so it actually has kr19.8b net cash.
A Look At SSAB's Liabilities
Zooming in on the latest balance sheet data, we can see that SSAB had liabilities of kr30.1b due within 12 months and liabilities of kr12.5b due beyond that. Offsetting this, it had kr27.7b in cash and kr15.6b in receivables that were due within 12 months. So these liquid assets roughly match the total liabilities.
This state of affairs indicates that SSAB's balance sheet looks quite solid, as its total liabilities are just about equal to its liquid assets. So it's very unlikely that the kr75.0b company is short on cash, but still worth keeping an eye on the balance sheet. Succinctly put, SSAB boasts net cash, so it's fair to say it does not have a heavy debt load! When analysing debt levels, the balance sheet is the obvious place to start. But it is future earnings, more than anything, that will determine SSAB's ability to maintain a healthy balance sheet going forward. So if you're focused on the future you can check out this free report showing analyst profit forecasts.
Over 12 months, SSAB made a loss at the EBIT level, and saw its revenue drop to kr123b, which is a fall of 2.2%. We would much prefer see growth.
So How Risky Is SSAB?
Although SSAB had an earnings before interest and tax (EBIT) loss over the last twelve months, it generated positive free cash flow of kr17b. So although it is loss-making, it doesn't seem to have too much near-term balance sheet risk, keeping in mind the net cash. With mediocre revenue growth in the last year, we're don't find the investment opportunity particularly compelling. The balance sheet is clearly the area to focus on when you are analysing debt. However, not all investment risk resides within the balance sheet - far from it. For example - SSAB has 1 warning sign we think you should be aware of.
Of course, if you're the type of investor who prefers buying stocks without the burden of debt, then don't hesitate to discover our exclusive list of net cash growth stocks, today.
The New Payments ETF Is Live on NASDAQ:
Money is moving to real-time rails, and a newly listed ETF now gives investors direct exposure. Fast settlement. Institutional custody. Simple access.
Explore how this launch could reshape portfolios
Sponsored ContentNew: Manage All Your Stock Portfolios in One Place
We've created the ultimate portfolio companion for stock investors, and it's free.
• Connect an unlimited number of Portfolios and see your total in one currency
• Be alerted to new Warning Signs or Risks via email or mobile
• Track the Fair Value of your stocks
Have feedback on this article? Concerned about the content? Get in touch with us directly. Alternatively, email editorial-team (at) simplywallst.com.
This article by Simply Wall St is general in nature. We provide commentary based on historical data and analyst forecasts only using an unbiased methodology and our articles are not intended to be financial advice. It does not constitute a recommendation to buy or sell any stock, and does not take account of your objectives, or your financial situation. We aim to bring you long-term focused analysis driven by fundamental data. Note that our analysis may not factor in the latest price-sensitive company announcements or qualitative material. Simply Wall St has no position in any stocks mentioned.
About OM:SSAB A
SSAB
Engages in the production and sale of steel products in Sweden, Finland, the Rest of Europe, the United States, and internationally.
Flawless balance sheet and undervalued.
Similar Companies
Market Insights

Weekly Picks

Early mover in a fast growing industry. Likely to experience share price volatility as they scale


A case for CA$31.80 (undiluted), aka 8,616% upside from CA$0.37 (an 86 bagger!).


Moderation and Stabilisation: HOLD: Fair Price based on a 4-year Cycle is $12.08
Recently Updated Narratives

A case for USD $14.81 per share based on book value. Be warned, this is a micro-cap dependent on a single mine.

Occidental Petroleum to Become Fairly Priced at $68.29 According to Future Projections

Agfa-Gevaert is a digital and materials turnaround opportunity, with growth potential in ZIRFON, but carrying legacy risks.
Popular Narratives


MicroVision will explode future revenue by 380.37% with a vision towards success


Crazy Undervalued 42 Baggers Silver Play (Active & Running Mine)


