Advertisement
- Italy
- /
- Real Estate
- /
- BIT:TCM
Discovering European Penny Stocks With Market Caps As Low As €10M

Simply Wall St
Reviewed by Simply Wall St
The European market recently experienced a downturn, with the STOXX Europe 600 Index dropping by 1.10% amid profit-taking and geopolitical tensions. Amidst such fluctuations, investors often look for opportunities in less conventional areas like penny stocks, which can offer unique growth potential. Although the term 'penny stocks' might seem dated, these investments often involve smaller or newer companies that could provide significant upside when backed by solid financials.
Top 10 Penny Stocks In Europe
| Name | Share Price | Market Cap | Rewards & Risks |
| Lucisano Media Group (BIT:LMG) | €1.12 | €16.64M | ✅ 4 ⚠️ 4 View Analysis > |
| Maps (BIT:MAPS) | €3.35 | €44.5M | ✅ 4 ⚠️ 1 View Analysis > |
| DigiTouch (BIT:DGT) | €1.99 | €27.5M | ✅ 3 ⚠️ 2 View Analysis > |
| Angler Gaming (NGM:ANGL) | SEK3.60 | SEK269.95M | ✅ 4 ⚠️ 2 View Analysis > |
| Angler Gaming (DB:0QM) | €0.37 | €225.7M | ✅ 2 ⚠️ 2 View Analysis > |
| Hove (CPSE:HOVE) | DKK4.40 | DKK111.25M | ✅ 2 ⚠️ 2 View Analysis > |
| Siili Solutions Oyj (HLSE:SIILI) | €4.70 | €38.11M | ✅ 3 ⚠️ 3 View Analysis > |
| Hifab Group (OM:HIFA B) | SEK3.42 | SEK208.07M | ✅ 2 ⚠️ 2 View Analysis > |
| Deceuninck (ENXTBR:DECB) | €2.055 | €284.04M | ✅ 4 ⚠️ 1 View Analysis > |
| Dovre Group (HLSE:DOV1V) | €0.0812 | €8.58M | ✅ 2 ⚠️ 3 View Analysis > |
Click here to see the full list of 275 stocks from our European Penny Stocks screener.
Below we spotlight a couple of our favorites from our exclusive screener.
Tecma Solutions (BIT:TCM)
Simply Wall St Financial Health Rating: ★★★★☆☆
Overview: Tecma Solutions S.p.A. is a tech company that develops technology and digital content for real estate businesses, with a market cap of €19.80 million.
Operations: The company's revenue is primarily generated from its Core segments, with €15.04 million from Operations and €0.93 million from R&D, while the Non-Core segment contributes €0.10 million.
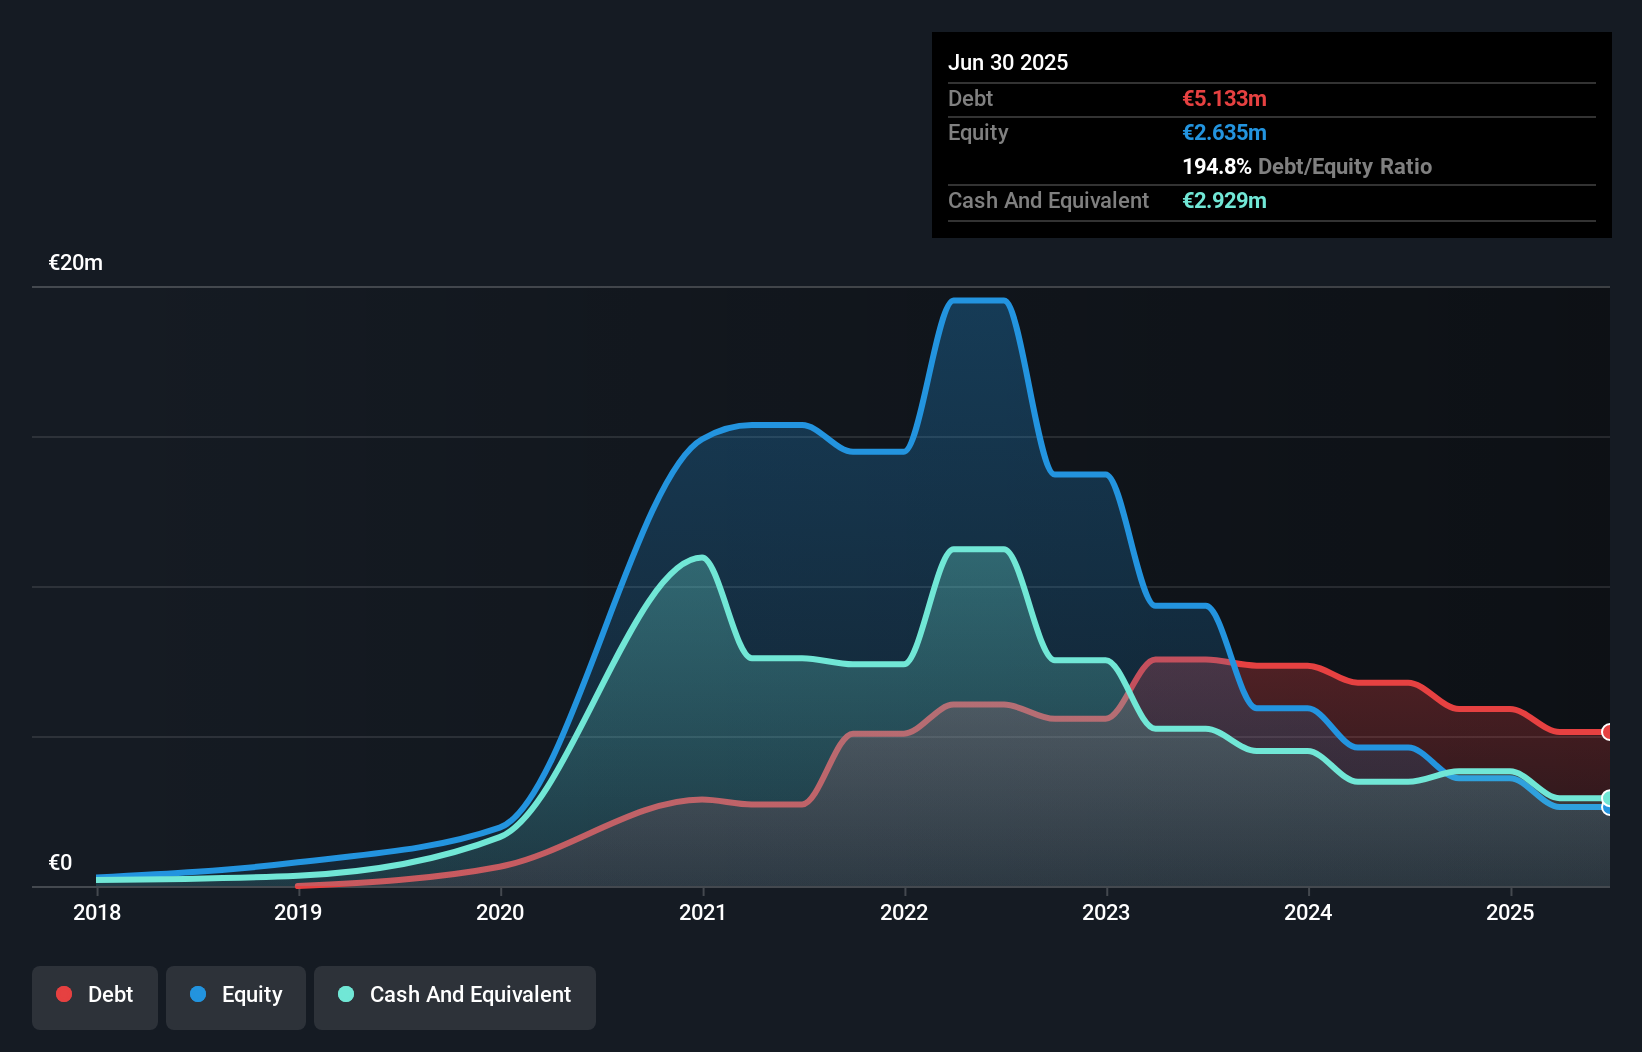
Market Cap: €19.8M
Tecma Solutions S.p.A., with a market cap of €19.80 million, reported half-year revenues of €7.53 million, slightly down from the previous year. Despite being unprofitable, the company has a positive cash flow and sufficient cash runway for over three years. However, its net debt to equity ratio is high at 83.7%, and share price volatility remains elevated compared to most Italian stocks. The board is experienced with an average tenure of 4.8 years, though management tenure data is insufficient. Revenue growth forecasts are optimistic at over 100% annually despite current financial challenges.
- Take a closer look at Tecma Solutions' potential here in our financial health report.
- Review our growth performance report to gain insights into Tecma Solutions' future.
Nexam Chemical Holding (OM:NEXAM)
Simply Wall St Financial Health Rating: ★★★★☆☆
Overview: Nexam Chemical Holding AB (publ) develops solutions to enhance the properties and performance of plastics in Sweden, Europe, and internationally, with a market cap of SEK297.77 million.
Operations: The company generates revenue from two main segments: Performance Chemicals, which accounts for SEK85.10 million, and Performance Masterbatch, contributing SEK111.21 million.
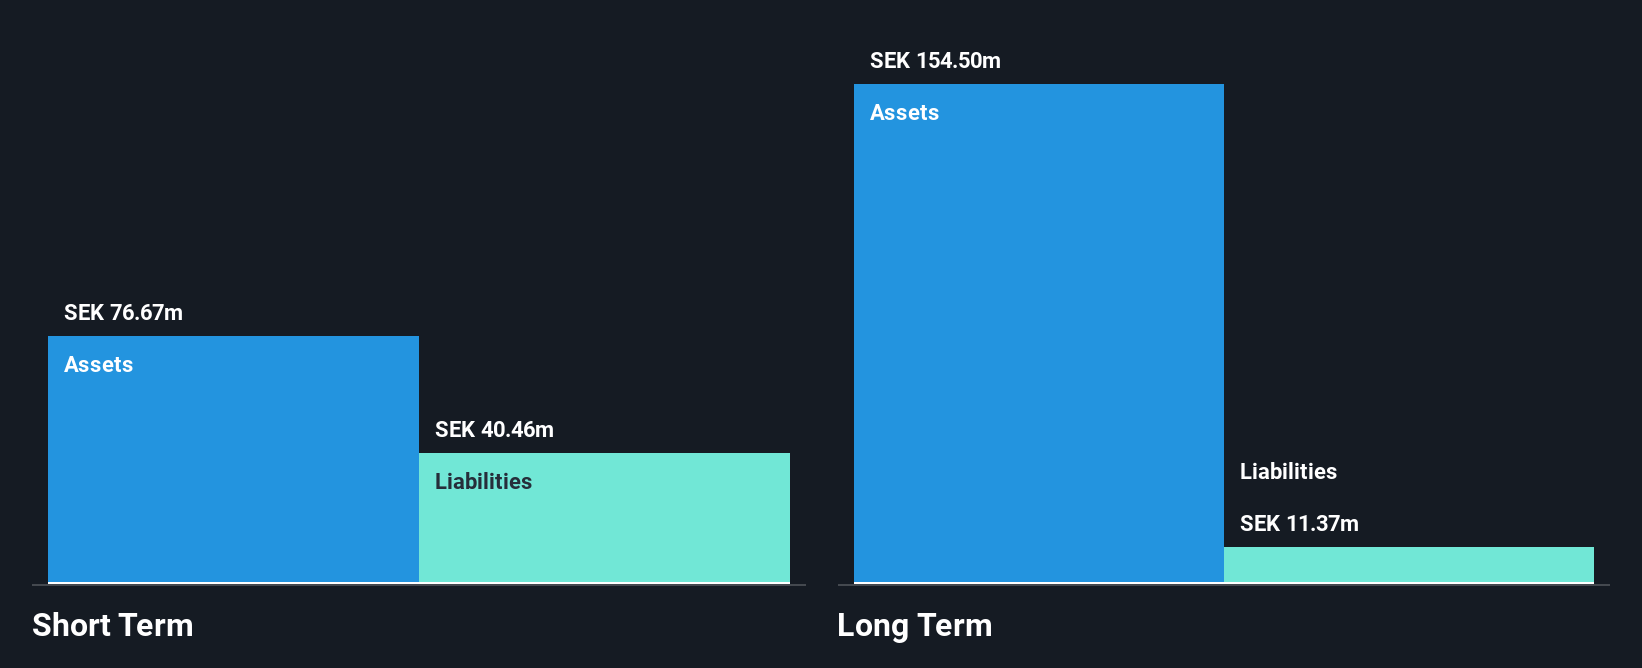
Market Cap: SEK297.77M
Nexam Chemical Holding AB, with a market cap of SEK297.77 million, remains unprofitable and has experienced increasing losses over the past five years. Despite trading at 50.8% below its estimated fair value, the company faces challenges with less than a year of cash runway based on current free cash flow. However, it maintains a satisfactory net debt to equity ratio of 11.9% and its short-term assets cover both short- and long-term liabilities comfortably. The board's average tenure is 3.6 years, indicating experience in navigating the company's strategic direction amidst financial hurdles.
- Get an in-depth perspective on Nexam Chemical Holding's performance by reading our balance sheet health report here.
- Evaluate Nexam Chemical Holding's prospects by accessing our earnings growth report.
Novavis Group (WSE:NVG)
Simply Wall St Financial Health Rating: ★★★★☆☆
Overview: Novavis Group S.A. focuses on developing, designing, and executing renewable energy projects in Poland with a market cap of PLN44.33 million.
Operations: The company generates revenue from services related to photovoltaics, amounting to PLN0.75 million.
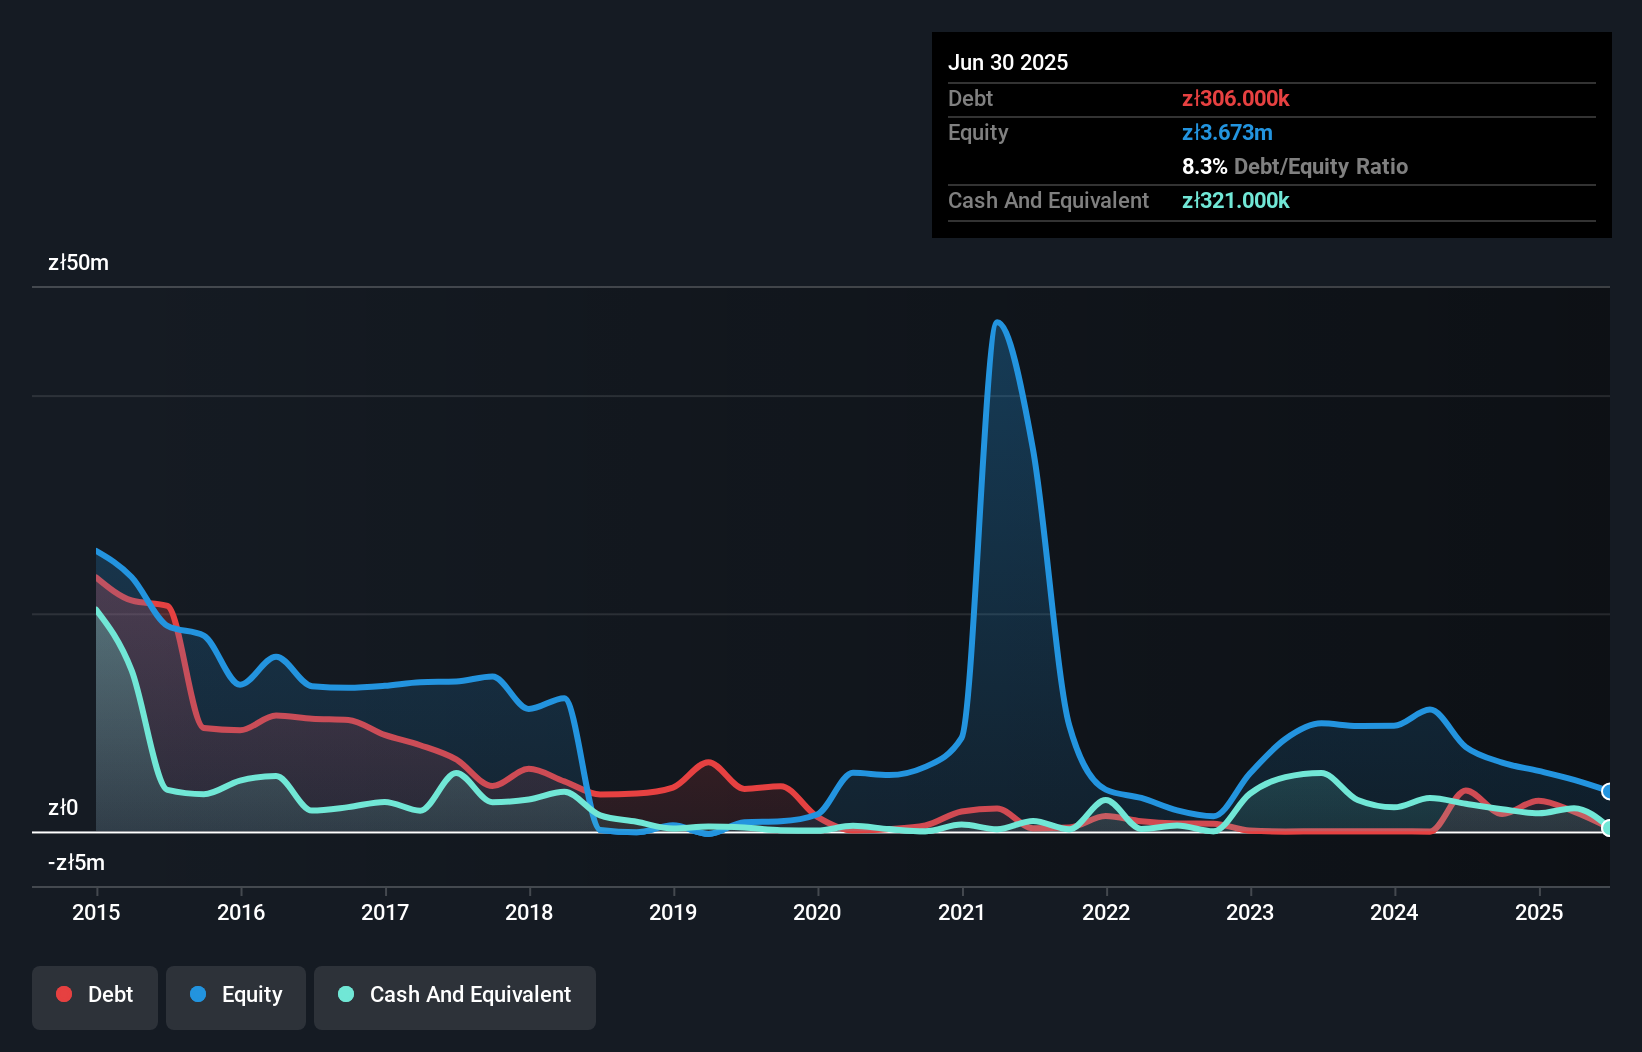
Market Cap: PLN44.33M
Novavis Group S.A., with a market cap of PLN44.33 million, is pre-revenue, generating only PLN0.75 million from its photovoltaic services. Recent earnings show a significant decline in revenue and an increased net loss compared to the previous year. Despite being unprofitable, Novavis has more cash than debt and maintains a positive free cash flow, ensuring over three years of cash runway if current trends continue. However, short-term liabilities significantly exceed assets by PLN23.3 million, posing financial challenges. The company has reduced losses by 11% annually over five years but faces volatility in returns amidst these constraints.
- Click to explore a detailed breakdown of our findings in Novavis Group's financial health report.
- Gain insights into Novavis Group's outlook and expected performance with our report on the company's earnings estimates.
Make It Happen
- Jump into our full catalog of 275 European Penny Stocks here.
- Looking For Alternative Opportunities? AI is about to change healthcare. These 33 stocks are working on everything from early diagnostics to drug discovery. The best part - they are all under $10b in market cap - there's still time to get in early.
This article by Simply Wall St is general in nature. We provide commentary based on historical data and analyst forecasts only using an unbiased methodology and our articles are not intended to be financial advice. It does not constitute a recommendation to buy or sell any stock, and does not take account of your objectives, or your financial situation. We aim to bring you long-term focused analysis driven by fundamental data. Note that our analysis may not factor in the latest price-sensitive company announcements or qualitative material. Simply Wall St has no position in any stocks mentioned.
Valuation is complex, but we're here to simplify it.
Discover if Tecma Solutions might be undervalued or overvalued with our detailed analysis, featuring fair value estimates, potential risks, dividends, insider trades, and its financial condition.
Access Free AnalysisHave feedback on this article? Concerned about the content? Get in touch with us directly. Alternatively, email editorial-team@simplywallst.com
About BIT:TCM
Tecma Solutions
A tech company, develops technology and digital content for real estate businesses.
High growth potential with adequate balance sheet.
Market Insights

Advertisement
Community Narratives
A formidable player in AI and enterprise computing.
Fair Value US$210.00|2.3% overvalued
CO
Community Contributor
IREN's Bold Moves in Sustainable Bitcoin Mining & AI Data Centers
Fair Value US$72.52|17.6% undervalued
BL
Community Contributor
Cooling the Champions: The Aussie Tech Behind F1's Victories
Fair Value AU$12.40|40.4% undervalued
TR
Community Contributor