- Sweden
- /
- Household Products
- /
- OM:ESSITY B
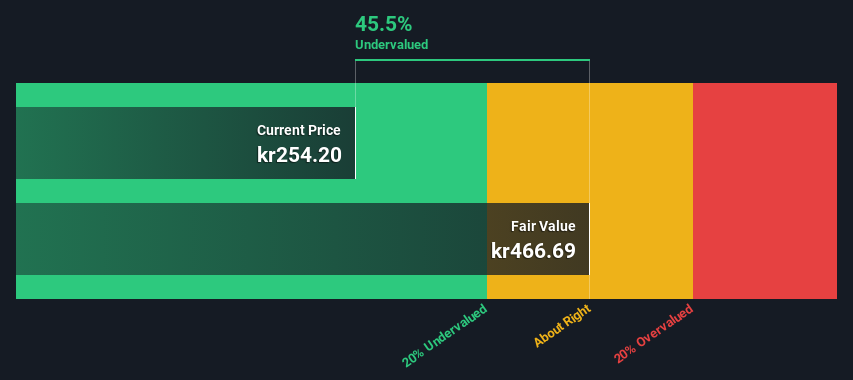
Is There An Opportunity With Essity AB (publ)'s (STO:ESSITY B) 46% Undervaluation?


Key Insights
- Essity's estimated fair value is kr467 based on 2 Stage Free Cash Flow to Equity
- Essity is estimated to be 46% undervalued based on current share price of kr254
- The kr279 analyst price target for ESSITY B is 40% less than our estimate of fair value
Today we will run through one way of estimating the intrinsic value of Essity AB (publ) (STO:ESSITY B) by taking the expected future cash flows and discounting them to today's value. Our analysis will employ the Discounted Cash Flow (DCF) model. There's really not all that much to it, even though it might appear quite complex.
Companies can be valued in a lot of ways, so we would point out that a DCF is not perfect for every situation. For those who are keen learners of equity analysis, the Simply Wall St analysis model here may be something of interest to you.
Check out our latest analysis for Essity
Crunching The Numbers
We are going to use a two-stage DCF model, which, as the name states, takes into account two stages of growth. The first stage is generally a higher growth period which levels off heading towards the terminal value, captured in the second 'steady growth' period. In the first stage we need to estimate the cash flows to the business over the next ten years. Where possible we use analyst estimates, but when these aren't available we extrapolate the previous free cash flow (FCF) from the last estimate or reported value. We assume companies with shrinking free cash flow will slow their rate of shrinkage, and that companies with growing free cash flow will see their growth rate slow, over this period. We do this to reflect that growth tends to slow more in the early years than it does in later years.
Generally we assume that a dollar today is more valuable than a dollar in the future, and so the sum of these future cash flows is then discounted to today's value:
10-year free cash flow (FCF) forecast
| 2024 | 2025 | 2026 | 2027 | 2028 | 2029 | 2030 | 2031 | 2032 | 2033 | |
| Levered FCF (SEK, Millions) | kr16.8b | kr12.5b | kr12.5b | kr12.4b | kr12.4b | kr12.5b | kr12.5b | kr12.6b | kr12.7b | kr12.8b |
| Growth Rate Estimate Source | Analyst x4 | Analyst x4 | Analyst x2 | Est @ -0.22% | Est @ 0.11% | Est @ 0.34% | Est @ 0.50% | Est @ 0.62% | Est @ 0.69% | Est @ 0.75% |
| Present Value (SEK, Millions) Discounted @ 4.6% | kr16.1k | kr11.5k | kr10.9k | kr10.4k | kr10.0k | kr9.6k | kr9.2k | kr8.8k | kr8.5k | kr8.2k |
("Est" = FCF growth rate estimated by Simply Wall St)
Present Value of 10-year Cash Flow (PVCF) = kr103b
We now need to calculate the Terminal Value, which accounts for all the future cash flows after this ten year period. For a number of reasons a very conservative growth rate is used that cannot exceed that of a country's GDP growth. In this case we have used the 5-year average of the 10-year government bond yield (0.9%) to estimate future growth. In the same way as with the 10-year 'growth' period, we discount future cash flows to today's value, using a cost of equity of 4.6%.
Terminal Value (TV)= FCF2033 × (1 + g) ÷ (r – g) = kr13b× (1 + 0.9%) ÷ (4.6%– 0.9%) = kr351b
Present Value of Terminal Value (PVTV)= TV / (1 + r)10= kr351b÷ ( 1 + 4.6%)10= kr225b
The total value, or equity value, is then the sum of the present value of the future cash flows, which in this case is kr328b. To get the intrinsic value per share, we divide this by the total number of shares outstanding. Compared to the current share price of kr254, the company appears quite good value at a 46% discount to where the stock price trades currently. Remember though, that this is just an approximate valuation, and like any complex formula - garbage in, garbage out.
The Assumptions
The calculation above is very dependent on two assumptions. The first is the discount rate and the other is the cash flows. You don't have to agree with these inputs, I recommend redoing the calculations yourself and playing with them. The DCF also does not consider the possible cyclicality of an industry, or a company's future capital requirements, so it does not give a full picture of a company's potential performance. Given that we are looking at Essity as potential shareholders, the cost of equity is used as the discount rate, rather than the cost of capital (or weighted average cost of capital, WACC) which accounts for debt. In this calculation we've used 4.6%, which is based on a levered beta of 0.800. Beta is a measure of a stock's volatility, compared to the market as a whole. We get our beta from the industry average beta of globally comparable companies, with an imposed limit between 0.8 and 2.0, which is a reasonable range for a stable business.
SWOT Analysis for Essity
- Earnings growth over the past year exceeded the industry.
- Debt is well covered by earnings and cashflows.
- Dividends are covered by earnings and cash flows.
- Dividend is low compared to the top 25% of dividend payers in the Household Products market.
- Annual revenue is forecast to grow faster than the Swedish market.
- Trading below our estimate of fair value by more than 20%.
- Annual earnings are forecast to grow slower than the Swedish market.
Next Steps:
Although the valuation of a company is important, it shouldn't be the only metric you look at when researching a company. DCF models are not the be-all and end-all of investment valuation. Rather it should be seen as a guide to "what assumptions need to be true for this stock to be under/overvalued?" If a company grows at a different rate, or if its cost of equity or risk free rate changes sharply, the output can look very different. Why is the intrinsic value higher than the current share price? For Essity, we've put together three fundamental elements you should explore:
- Risks: For example, we've discovered 2 warning signs for Essity that you should be aware of before investing here.
- Management:Have insiders been ramping up their shares to take advantage of the market's sentiment for ESSITY B's future outlook? Check out our management and board analysis with insights on CEO compensation and governance factors.
- Other Solid Businesses: Low debt, high returns on equity and good past performance are fundamental to a strong business. Why not explore our interactive list of stocks with solid business fundamentals to see if there are other companies you may not have considered!
PS. The Simply Wall St app conducts a discounted cash flow valuation for every stock on the OM every day. If you want to find the calculation for other stocks just search here.
Valuation is complex, but we're here to simplify it.
Discover if Essity might be undervalued or overvalued with our detailed analysis, featuring fair value estimates, potential risks, dividends, insider trades, and its financial condition.
Access Free AnalysisHave feedback on this article? Concerned about the content? Get in touch with us directly. Alternatively, email editorial-team (at) simplywallst.com.
This article by Simply Wall St is general in nature. We provide commentary based on historical data and analyst forecasts only using an unbiased methodology and our articles are not intended to be financial advice. It does not constitute a recommendation to buy or sell any stock, and does not take account of your objectives, or your financial situation. We aim to bring you long-term focused analysis driven by fundamental data. Note that our analysis may not factor in the latest price-sensitive company announcements or qualitative material. Simply Wall St has no position in any stocks mentioned.
About OM:ESSITY B
Essity
Develops, produces, and sells hygiene and health products and services in Europe, North and Latin America, Asia, and internationally.
Flawless balance sheet and undervalued.

