- Sweden
- /
- Healthtech
- /
- OM:PTRK
Physitrack PLC's (STO:PTRK) 26% Dip In Price Shows Sentiment Is Matching Revenues

Physitrack PLC (STO:PTRK) shares have retraced a considerable 26% in the last month, reversing a fair amount of their solid recent performance. The drop over the last 30 days has capped off a tough year for shareholders, with the share price down 35% in that time.
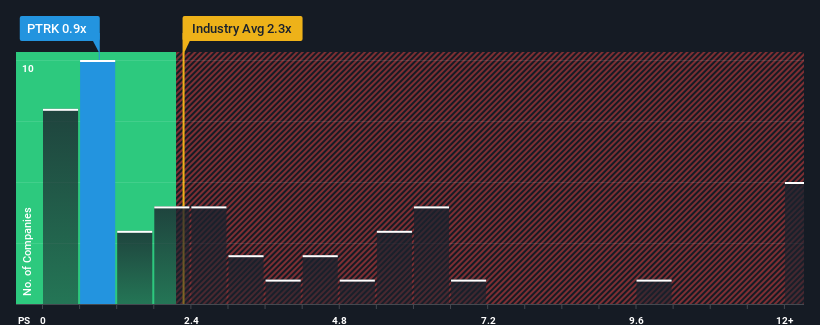
Since its price has dipped substantially, Physitrack may be sending buy signals at present with its price-to-sales (or "P/S") ratio of 0.9x, considering almost half of all companies in the Healthcare Services industry in Sweden have P/S ratios greater than 1.8x and even P/S higher than 6x aren't out of the ordinary. Nonetheless, we'd need to dig a little deeper to determine if there is a rational basis for the reduced P/S.
View our latest analysis for Physitrack
What Does Physitrack's Recent Performance Look Like?
Physitrack could be doing better as it's been growing revenue less than most other companies lately. The P/S ratio is probably low because investors think this lacklustre revenue performance isn't going to get any better. If this is the case, then existing shareholders will probably struggle to get excited about the future direction of the share price.
Keen to find out how analysts think Physitrack's future stacks up against the industry? In that case, our free report is a great place to start .How Is Physitrack's Revenue Growth Trending?
There's an inherent assumption that a company should underperform the industry for P/S ratios like Physitrack's to be considered reasonable.
Retrospectively, the last year delivered a decent 9.7% gain to the company's revenues. The latest three year period has also seen an excellent 107% overall rise in revenue, aided somewhat by its short-term performance. Therefore, it's fair to say the revenue growth recently has been superb for the company.
Looking ahead now, revenue is anticipated to climb by 8.4% per year during the coming three years according to the sole analyst following the company. Meanwhile, the rest of the industry is forecast to expand by 18% per annum, which is noticeably more attractive.
With this in consideration, its clear as to why Physitrack's P/S is falling short industry peers. It seems most investors are expecting to see limited future growth and are only willing to pay a reduced amount for the stock.
The Final Word
Physitrack's P/S has taken a dip along with its share price. We'd say the price-to-sales ratio's power isn't primarily as a valuation instrument but rather to gauge current investor sentiment and future expectations.
As expected, our analysis of Physitrack's analyst forecasts confirms that the company's underwhelming revenue outlook is a major contributor to its low P/S. Right now shareholders are accepting the low P/S as they concede future revenue probably won't provide any pleasant surprises. It's hard to see the share price rising strongly in the near future under these circumstances.
It's always necessary to consider the ever-present spectre of investment risk. We've identified 2 warning signs with Physitrack , and understanding them should be part of your investment process.
If strong companies turning a profit tickle your fancy, then you'll want to check out this free list of interesting companies that trade on a low P/E (but have proven they can grow earnings).
The New Payments ETF Is Live on NASDAQ:
Money is moving to real-time rails, and a newly listed ETF now gives investors direct exposure. Fast settlement. Institutional custody. Simple access.
Explore how this launch could reshape portfolios
Sponsored ContentNew: Manage All Your Stock Portfolios in One Place
We've created the ultimate portfolio companion for stock investors, and it's free.
• Connect an unlimited number of Portfolios and see your total in one currency
• Be alerted to new Warning Signs or Risks via email or mobile
• Track the Fair Value of your stocks
Have feedback on this article? Concerned about the content? Get in touch with us directly. Alternatively, email editorial-team (at) simplywallst.com.
This article by Simply Wall St is general in nature. We provide commentary based on historical data and analyst forecasts only using an unbiased methodology and our articles are not intended to be financial advice. It does not constitute a recommendation to buy or sell any stock, and does not take account of your objectives, or your financial situation. We aim to bring you long-term focused analysis driven by fundamental data. Note that our analysis may not factor in the latest price-sensitive company announcements or qualitative material. Simply Wall St has no position in any stocks mentioned.
About OM:PTRK
Physitrack
Provides digital healthcare solutions in the United Kingdom, Europe, North America, and internationally.
Good value with adequate balance sheet.
Similar Companies
Market Insights

Weekly Picks

THE KINGDOM OF BROWN GOODS: WHY MGPI IS BEING CRUSHED BY INVENTORY & PRIMED FOR RESURRECTION


Why Vertical Aerospace (NYSE: EVTL) is Worth Possibly Over 13x its Current Price


The Quiet Giant That Became AI’s Power Grid
Recently Updated Narratives


A tech powerhouse quietly powering the world’s AI infrastructure.


Keppel DC REIT (SGX: AJBU) is a resilient gem in the data center space.
Why Vertical Aerospace (NYSE: EVTL) is Worth Possibly Over 13x its Current Price
Popular Narratives

MicroVision will explode future revenue by 380.37% with a vision towards success


Crazy Undervalued 42 Baggers Silver Play (Active & Running Mine)


