- Sweden
- /
- Consumer Finance
- /
- OM:YIELD
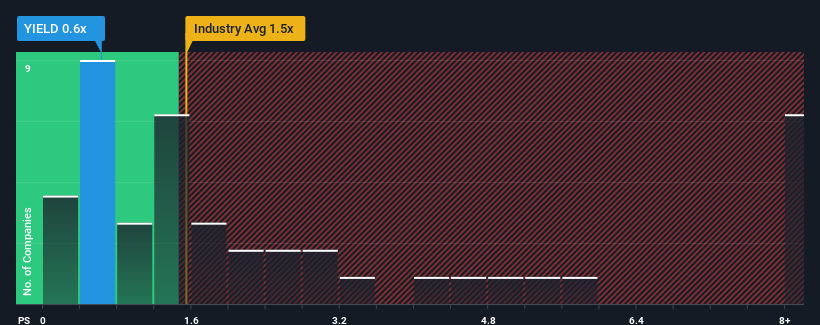
Little Excitement Around SaveLend Group AB (publ)'s (STO:YIELD) Revenues


SaveLend Group AB (publ)'s (STO:YIELD) price-to-sales (or "P/S") ratio of 0.6x might make it look like a buy right now compared to the Consumer Finance industry in Sweden, where around half of the companies have P/S ratios above 1.5x and even P/S above 4x are quite common. Nonetheless, we'd need to dig a little deeper to determine if there is a rational basis for the reduced P/S.
See our latest analysis for SaveLend Group
What Does SaveLend Group's Recent Performance Look Like?
While the industry has experienced revenue growth lately, SaveLend Group's revenue has gone into reverse gear, which is not great. Perhaps the P/S remains low as investors think the prospects of strong revenue growth aren't on the horizon. If you still like the company, you'd be hoping this isn't the case so that you could potentially pick up some stock while it's out of favour.
If you'd like to see what analysts are forecasting going forward, you should check out our free report on SaveLend Group.Is There Any Revenue Growth Forecasted For SaveLend Group?
There's an inherent assumption that a company should underperform the industry for P/S ratios like SaveLend Group's to be considered reasonable.
Retrospectively, the last year delivered a frustrating 8.1% decrease to the company's top line. Even so, admirably revenue has lifted 99% in aggregate from three years ago, notwithstanding the last 12 months. So we can start by confirming that the company has generally done a very good job of growing revenue over that time, even though it had some hiccups along the way.
Looking ahead now, revenue is anticipated to climb by 15% during the coming year according to the one analyst following the company. Meanwhile, the rest of the industry is forecast to expand by 28%, which is noticeably more attractive.
With this information, we can see why SaveLend Group is trading at a P/S lower than the industry. It seems most investors are expecting to see limited future growth and are only willing to pay a reduced amount for the stock.
What We Can Learn From SaveLend Group's P/S?
Using the price-to-sales ratio alone to determine if you should sell your stock isn't sensible, however it can be a practical guide to the company's future prospects.
As expected, our analysis of SaveLend Group's analyst forecasts confirms that the company's underwhelming revenue outlook is a major contributor to its low P/S. At this stage investors feel the potential for an improvement in revenue isn't great enough to justify a higher P/S ratio. The company will need a change of fortune to justify the P/S rising higher in the future.
Plus, you should also learn about these 2 warning signs we've spotted with SaveLend Group (including 1 which shouldn't be ignored).
If you're unsure about the strength of SaveLend Group's business, why not explore our interactive list of stocks with solid business fundamentals for some other companies you may have missed.
If you're looking to trade SaveLend Group, open an account with the lowest-cost platform trusted by professionals, Interactive Brokers.
With clients in over 200 countries and territories, and access to 160 markets, IBKR lets you trade stocks, options, futures, forex, bonds and funds from a single integrated account.
Enjoy no hidden fees, no account minimums, and FX conversion rates as low as 0.03%, far better than what most brokers offer.
Sponsored ContentNew: Manage All Your Stock Portfolios in One Place
We've created the ultimate portfolio companion for stock investors, and it's free.
• Connect an unlimited number of Portfolios and see your total in one currency
• Be alerted to new Warning Signs or Risks via email or mobile
• Track the Fair Value of your stocks
Have feedback on this article? Concerned about the content? Get in touch with us directly. Alternatively, email editorial-team (at) simplywallst.com.
This article by Simply Wall St is general in nature. We provide commentary based on historical data and analyst forecasts only using an unbiased methodology and our articles are not intended to be financial advice. It does not constitute a recommendation to buy or sell any stock, and does not take account of your objectives, or your financial situation. We aim to bring you long-term focused analysis driven by fundamental data. Note that our analysis may not factor in the latest price-sensitive company announcements or qualitative material. Simply Wall St has no position in any stocks mentioned.
About OM:YIELD
SaveLend Group
Through its subsidiaries, operates as a fintech company in the fixed income investment segment in Sweden, Poland, and Finland.
High growth potential and fair value.

