- Sweden
- /
- Commercial Services
- /
- OM:LAMM B
Some Investors May Be Worried About Lammhults Design Group's (STO:LAMM B) Returns On Capital


If you're looking at a mature business that's past the growth phase, what are some of the underlying trends that pop up? Typically, we'll see the trend of both return on capital employed (ROCE) declining and this usually coincides with a decreasing amount of capital employed. This indicates the company is producing less profit from its investments and its total assets are decreasing. So after glancing at the trends within Lammhults Design Group (STO:LAMM B), we weren't too hopeful.
Return On Capital Employed (ROCE): What Is It?
For those who don't know, ROCE is a measure of a company's yearly pre-tax profit (its return), relative to the capital employed in the business. Analysts use this formula to calculate it for Lammhults Design Group:
Return on Capital Employed = Earnings Before Interest and Tax (EBIT) ÷ (Total Assets - Current Liabilities)
0.017 = kr8.1m ÷ (kr793m - kr311m) (Based on the trailing twelve months to December 2024).
So, Lammhults Design Group has an ROCE of 1.7%. In absolute terms, that's a low return and it also under-performs the Commercial Services industry average of 9.5%.
Check out our latest analysis for Lammhults Design Group
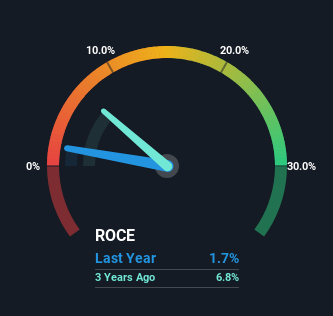
Historical performance is a great place to start when researching a stock so above you can see the gauge for Lammhults Design Group's ROCE against it's prior returns. If you're interested in investigating Lammhults Design Group's past further, check out this free graph covering Lammhults Design Group's past earnings, revenue and cash flow.
The Trend Of ROCE
We are a bit anxious about the trends of ROCE at Lammhults Design Group. To be more specific, today's ROCE was 12% five years ago but has since fallen to 1.7%. What's equally concerning is that the amount of capital deployed in the business has shrunk by 20% over that same period. The combination of lower ROCE and less capital employed can indicate that a business is likely to be facing some competitive headwinds or seeing an erosion to its moat. If these underlying trends continue, we wouldn't be too optimistic going forward.
The Bottom Line
To see Lammhults Design Group reducing the capital employed in the business in tandem with diminishing returns, is concerning. Despite the concerning underlying trends, the stock has actually gained 16% over the last five years, so it might be that the investors are expecting the trends to reverse. Regardless, we don't like the trends as they are and if they persist, we think you might find better investments elsewhere.
Lammhults Design Group does come with some risks though, we found 3 warning signs in our investment analysis, and 1 of those is a bit unpleasant...
If you want to search for solid companies with great earnings, check out this free list of companies with good balance sheets and impressive returns on equity.
If you're looking to trade Lammhults Design Group, open an account with the lowest-cost platform trusted by professionals, Interactive Brokers.
With clients in over 200 countries and territories, and access to 160 markets, IBKR lets you trade stocks, options, futures, forex, bonds and funds from a single integrated account.
Enjoy no hidden fees, no account minimums, and FX conversion rates as low as 0.03%, far better than what most brokers offer.
Sponsored ContentNew: AI Stock Screener & Alerts
Our new AI Stock Screener scans the market every day to uncover opportunities.
• Dividend Powerhouses (3%+ Yield)
• Undervalued Small Caps with Insider Buying
• High growth Tech and AI Companies
Or build your own from over 50 metrics.
Have feedback on this article? Concerned about the content? Get in touch with us directly. Alternatively, email editorial-team (at) simplywallst.com.
This article by Simply Wall St is general in nature. We provide commentary based on historical data and analyst forecasts only using an unbiased methodology and our articles are not intended to be financial advice. It does not constitute a recommendation to buy or sell any stock, and does not take account of your objectives, or your financial situation. We aim to bring you long-term focused analysis driven by fundamental data. Note that our analysis may not factor in the latest price-sensitive company announcements or qualitative material. Simply Wall St has no position in any stocks mentioned.
About OM:LAMM B
Lammhults Design Group
Engages in the design, development, and sale of office and library interiors.
Good value with mediocre balance sheet.
Market Insights

Community Narratives

