Trelleborg's (STO:TREL B) Solid Earnings Have Been Accounted For Conservatively


Trelleborg AB (publ)'s (STO:TREL B) recent earnings report didn't offer any surprises, with the shares unchanged over the last week. We did some analysis to find out why and believe that investors might be missing some encouraging factors contained in the earnings.
View our latest analysis for Trelleborg
Examining Cashflow Against Trelleborg's Earnings
One key financial ratio used to measure how well a company converts its profit to free cash flow (FCF) is the accrual ratio. In plain english, this ratio subtracts FCF from net profit, and divides that number by the company's average operating assets over that period. You could think of the accrual ratio from cashflow as the 'non-FCF profit ratio'.
That means a negative accrual ratio is a good thing, because it shows that the company is bringing in more free cash flow than its profit would suggest. While it's not a problem to have a positive accrual ratio, indicating a certain level of non-cash profits, a high accrual ratio is arguably a bad thing, because it indicates paper profits are not matched by cash flow. Notably, there is some academic evidence that suggests that a high accrual ratio is a bad sign for near-term profits, generally speaking.
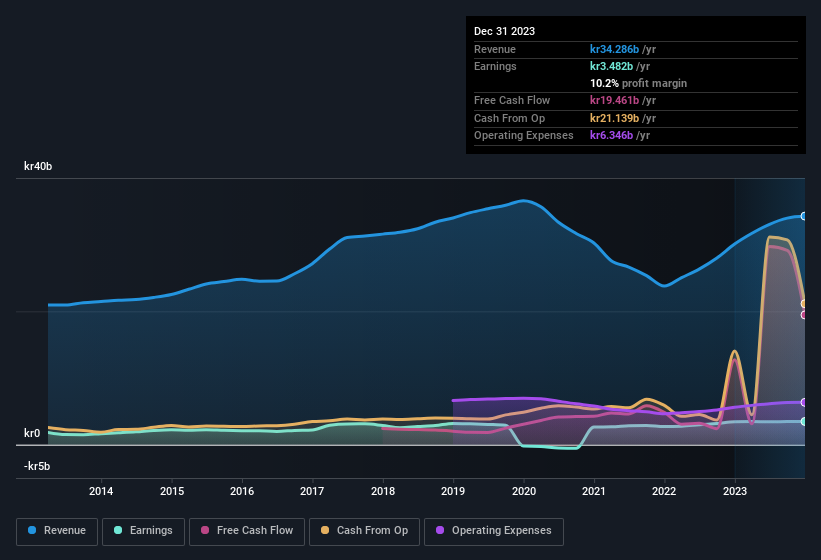
Trelleborg has an accrual ratio of -0.34 for the year to December 2023. That indicates that its free cash flow quite significantly exceeded its statutory profit. To wit, it produced free cash flow of kr19b during the period, dwarfing its reported profit of kr3.48b. Trelleborg's free cash flow improved over the last year, which is generally good to see.
That might leave you wondering what analysts are forecasting in terms of future profitability. Luckily, you can click here to see an interactive graph depicting future profitability, based on their estimates.
Our Take On Trelleborg's Profit Performance
As we discussed above, Trelleborg's accrual ratio indicates strong conversion of profit to free cash flow, which is a positive for the company. Because of this, we think Trelleborg's underlying earnings potential is as good as, or possibly even better, than the statutory profit makes it seem! And on top of that, its earnings per share have grown at 42% per year over the last three years. At the end of the day, it's essential to consider more than just the factors above, if you want to understand the company properly. In light of this, if you'd like to do more analysis on the company, it's vital to be informed of the risks involved. For example, we've discovered 1 warning sign that you should run your eye over to get a better picture of Trelleborg.
This note has only looked at a single factor that sheds light on the nature of Trelleborg's profit. But there are plenty of other ways to inform your opinion of a company. Some people consider a high return on equity to be a good sign of a quality business. While it might take a little research on your behalf, you may find this free collection of companies boasting high return on equity, or this list of stocks that insiders are buying to be useful.
If you're looking to trade Trelleborg, open an account with the lowest-cost platform trusted by professionals, Interactive Brokers.
With clients in over 200 countries and territories, and access to 160 markets, IBKR lets you trade stocks, options, futures, forex, bonds and funds from a single integrated account.
Enjoy no hidden fees, no account minimums, and FX conversion rates as low as 0.03%, far better than what most brokers offer.
Sponsored ContentValuation is complex, but we're here to simplify it.
Discover if Trelleborg might be undervalued or overvalued with our detailed analysis, featuring fair value estimates, potential risks, dividends, insider trades, and its financial condition.
Access Free AnalysisHave feedback on this article? Concerned about the content? Get in touch with us directly. Alternatively, email editorial-team (at) simplywallst.com.
This article by Simply Wall St is general in nature. We provide commentary based on historical data and analyst forecasts only using an unbiased methodology and our articles are not intended to be financial advice. It does not constitute a recommendation to buy or sell any stock, and does not take account of your objectives, or your financial situation. We aim to bring you long-term focused analysis driven by fundamental data. Note that our analysis may not factor in the latest price-sensitive company announcements or qualitative material. Simply Wall St has no position in any stocks mentioned.
About OM:TREL B
Trelleborg
Provides engineered polymer solutions for seal, damp, and protect critical applications worldwide.
Flawless balance sheet, good value and pays a dividend.

