

Howard Marks put it nicely when he said that, rather than worrying about share price volatility, 'The possibility of permanent loss is the risk I worry about... and every practical investor I know worries about.' So it might be obvious that you need to consider debt, when you think about how risky any given stock is, because too much debt can sink a company. As with many other companies Saab AB (publ) (STO:SAAB B) makes use of debt. But should shareholders be worried about its use of debt?
When Is Debt A Problem?
Generally speaking, debt only becomes a real problem when a company can't easily pay it off, either by raising capital or with its own cash flow. In the worst case scenario, a company can go bankrupt if it cannot pay its creditors. However, a more common (but still painful) scenario is that it has to raise new equity capital at a low price, thus permanently diluting shareholders. Of course, debt can be an important tool in businesses, particularly capital heavy businesses. The first thing to do when considering how much debt a business uses is to look at its cash and debt together.
See our latest analysis for Saab
How Much Debt Does Saab Carry?
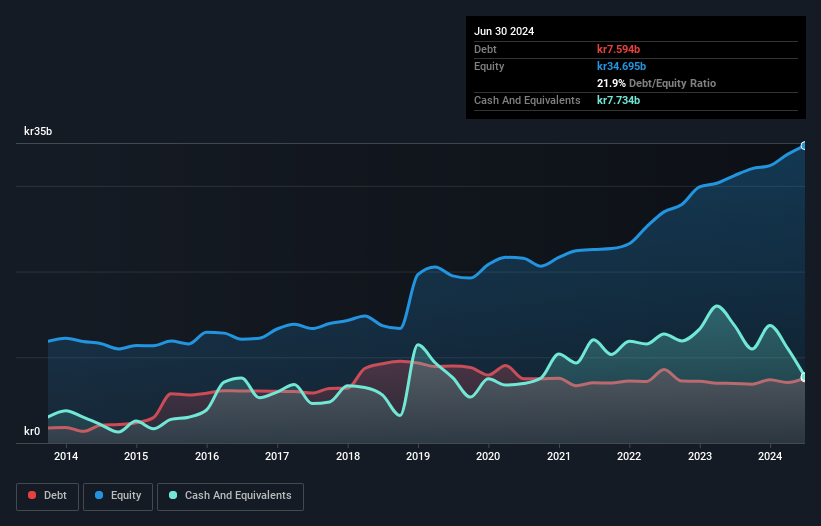
The image below, which you can click on for greater detail, shows that at June 2024 Saab had debt of kr7.59b, up from kr6.95b in one year. But it also has kr7.73b in cash to offset that, meaning it has kr140.0m net cash.
How Strong Is Saab's Balance Sheet?
The latest balance sheet data shows that Saab had liabilities of kr39.0b due within a year, and liabilities of kr14.0b falling due after that. Offsetting these obligations, it had cash of kr7.73b as well as receivables valued at kr26.4b due within 12 months. So its liabilities outweigh the sum of its cash and (near-term) receivables by kr18.8b.
Of course, Saab has a titanic market capitalization of kr118.3b, so these liabilities are probably manageable. However, we do think it is worth keeping an eye on its balance sheet strength, as it may change over time. Despite its noteworthy liabilities, Saab boasts net cash, so it's fair to say it does not have a heavy debt load!
Another good sign is that Saab has been able to increase its EBIT by 29% in twelve months, making it easier to pay down debt. The balance sheet is clearly the area to focus on when you are analysing debt. But it is future earnings, more than anything, that will determine Saab's ability to maintain a healthy balance sheet going forward. So if you're focused on the future you can check out this free report showing analyst profit forecasts.
But our final consideration is also important, because a company cannot pay debt with paper profits; it needs cold hard cash. While Saab has net cash on its balance sheet, it's still worth taking a look at its ability to convert earnings before interest and tax (EBIT) to free cash flow, to help us understand how quickly it is building (or eroding) that cash balance. Over the last three years, Saab reported free cash flow worth 7.9% of its EBIT, which is really quite low. For us, cash conversion that low sparks a little paranoia about is ability to extinguish debt.
Summing Up
While Saab does have more liabilities than liquid assets, it also has net cash of kr140.0m. And we liked the look of last year's 29% year-on-year EBIT growth. So we don't have any problem with Saab's use of debt. There's no doubt that we learn most about debt from the balance sheet. But ultimately, every company can contain risks that exist outside of the balance sheet. Be aware that Saab is showing 2 warning signs in our investment analysis , and 1 of those is a bit concerning...
If you're interested in investing in businesses that can grow profits without the burden of debt, then check out this free list of growing businesses that have net cash on the balance sheet.
New: Manage All Your Stock Portfolios in One Place
We've created the ultimate portfolio companion for stock investors, and it's free.
• Connect an unlimited number of Portfolios and see your total in one currency
• Be alerted to new Warning Signs or Risks via email or mobile
• Track the Fair Value of your stocks
Have feedback on this article? Concerned about the content? Get in touch with us directly. Alternatively, email editorial-team (at) simplywallst.com.
This article by Simply Wall St is general in nature. We provide commentary based on historical data and analyst forecasts only using an unbiased methodology and our articles are not intended to be financial advice. It does not constitute a recommendation to buy or sell any stock, and does not take account of your objectives, or your financial situation. We aim to bring you long-term focused analysis driven by fundamental data. Note that our analysis may not factor in the latest price-sensitive company announcements or qualitative material. Simply Wall St has no position in any stocks mentioned.
About OM:SAAB B
Saab
Provides products, services, and solutions for military defense, aviation, and civil security markets Internationally.
Flawless balance sheet with moderate growth potential.

