Further Upside For Precomp Solutions AB (publ) (STO:PCOM B) Shares Could Introduce Price Risks After 62% Bounce
Precomp Solutions AB (publ) (STO:PCOM B) shares have continued their recent momentum with a 62% gain in the last month alone. The annual gain comes to 123% following the latest surge, making investors sit up and take notice.
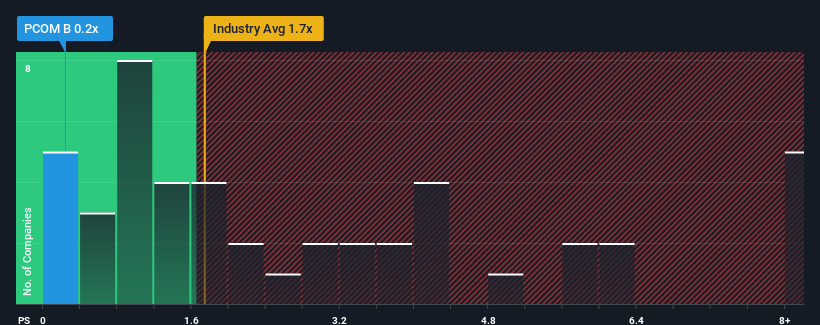
Although its price has surged higher, Precomp Solutions may still be sending buy signals at present with its price-to-sales (or "P/S") ratio of 0.2x, considering almost half of all companies in the Machinery industry in Sweden have P/S ratios greater than 1.7x and even P/S higher than 5x aren't out of the ordinary. Although, it's not wise to just take the P/S at face value as there may be an explanation why it's limited.
Check out our latest analysis for Precomp Solutions

How Has Precomp Solutions Performed Recently?
For example, consider that Precomp Solutions' financial performance has been poor lately as its revenue has been in decline. It might be that many expect the disappointing revenue performance to continue or accelerate, which has repressed the P/S. However, if this doesn't eventuate then existing shareholders may be feeling optimistic about the future direction of the share price.
Want the full picture on earnings, revenue and cash flow for the company? Then our free report on Precomp Solutions will help you shine a light on its historical performance.Is There Any Revenue Growth Forecasted For Precomp Solutions?
In order to justify its P/S ratio, Precomp Solutions would need to produce sluggish growth that's trailing the industry.
Retrospectively, the last year delivered a frustrating 11% decrease to the company's top line. Regardless, revenue has managed to lift by a handy 6.4% in aggregate from three years ago, thanks to the earlier period of growth. Accordingly, while they would have preferred to keep the run going, shareholders would be roughly satisfied with the medium-term rates of revenue growth.
It's interesting to note that the rest of the industry is similarly expected to grow by 3.1% over the next year, which is fairly even with the company's recent medium-term annualised growth rates.
With this information, we find it odd that Precomp Solutions is trading at a P/S lower than the industry. It may be that most investors are not convinced the company can maintain recent growth rates.
The Final Word
Precomp Solutions' stock price has surged recently, but its but its P/S still remains modest. It's argued the price-to-sales ratio is an inferior measure of value within certain industries, but it can be a powerful business sentiment indicator.
Our examination of Precomp Solutions revealed its three-year revenue trends looking similar to current industry expectations hasn't given the P/S the boost we expected, given that it's lower than the wider industry P/S, There could be some unobserved threats to revenue preventing the P/S ratio from matching the company's performance. It appears some are indeed anticipating revenue instability, because the persistence of these recent medium-term conditions should normally provide more support to the share price.
You should always think about risks. Case in point, we've spotted 4 warning signs for Precomp Solutions you should be aware of.
It's important to make sure you look for a great company, not just the first idea you come across. So if growing profitability aligns with your idea of a great company, take a peek at this free list of interesting companies with strong recent earnings growth (and a low P/E).
New: Manage All Your Stock Portfolios in One Place
We've created the ultimate portfolio companion for stock investors, and it's free.
• Connect an unlimited number of Portfolios and see your total in one currency
• Be alerted to new Warning Signs or Risks via email or mobile
• Track the Fair Value of your stocks
Have feedback on this article? Concerned about the content? Get in touch with us directly. Alternatively, email editorial-team (at) simplywallst.com.
This article by Simply Wall St is general in nature. We provide commentary based on historical data and analyst forecasts only using an unbiased methodology and our articles are not intended to be financial advice. It does not constitute a recommendation to buy or sell any stock, and does not take account of your objectives, or your financial situation. We aim to bring you long-term focused analysis driven by fundamental data. Note that our analysis may not factor in the latest price-sensitive company announcements or qualitative material. Simply Wall St has no position in any stocks mentioned.
About OM:PCOM B
Precomp Solutions
Manufactures and supplies precision components and cutting tools in Europe.
Slight risk with questionable track record.
Market Insights
Weekly Picks

Solutions by stc: 34% Upside in Saudi's Digital Transformation Leader


The AI Infrastructure Giant Grows Into Its Valuation
Recently Updated Narratives

Perdana Petroleum Berhad is a Zombie Business with a 27.34% Profit Margin and inflation adjusted revenue Business
Many trends acting at the same time


Engineered for Stability. Positioned for Growth.
Popular Narratives


MicroVision will explode future revenue by 380.37% with a vision towards success


NVDA: Expanding AI Demand Will Drive Major Data Center Investments Through 2026


