
Advertisement
Positive Sentiment Still Eludes Nordic Flanges Group AB (publ) (STO:NFGAB) Following 31% Share Price Slump
The Nordic Flanges Group AB (publ) (STO:NFGAB) share price has softened a substantial 31% over the previous 30 days, handing back much of the gains the stock has made lately. For any long-term shareholders, the last month ends a year to forget by locking in a 57% share price decline.
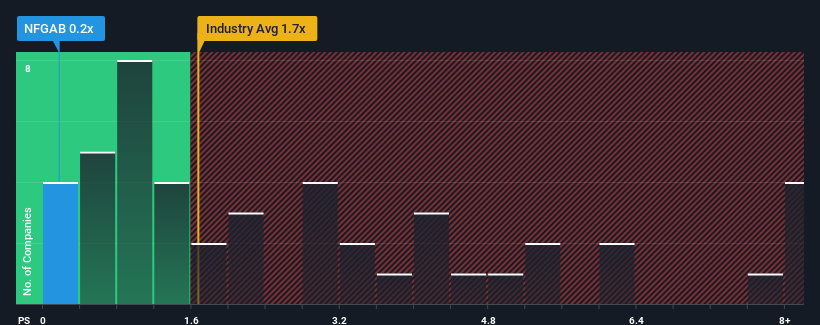
Following the heavy fall in price, Nordic Flanges Group may be sending bullish signals at the moment with its price-to-sales (or "P/S") ratio of 0.2x, since almost half of all companies in the Machinery industry in Sweden have P/S ratios greater than 1.7x and even P/S higher than 5x are not unusual. However, the P/S might be low for a reason and it requires further investigation to determine if it's justified.
View our latest analysis for Nordic Flanges Group
What Does Nordic Flanges Group's P/S Mean For Shareholders?
As an illustration, revenue has deteriorated at Nordic Flanges Group over the last year, which is not ideal at all. Perhaps the market believes the recent revenue performance isn't good enough to keep up the industry, causing the P/S ratio to suffer. However, if this doesn't eventuate then existing shareholders may be feeling optimistic about the future direction of the share price.
Although there are no analyst estimates available for Nordic Flanges Group, take a look at this free data-rich visualisation to see how the company stacks up on earnings, revenue and cash flow.Do Revenue Forecasts Match The Low P/S Ratio?
The only time you'd be truly comfortable seeing a P/S as low as Nordic Flanges Group's is when the company's growth is on track to lag the industry.
Taking a look back first, the company's revenue growth last year wasn't something to get excited about as it posted a disappointing decline of 11%. Even so, admirably revenue has lifted 39% in aggregate from three years ago, notwithstanding the last 12 months. So we can start by confirming that the company has generally done a very good job of growing revenue over that time, even though it had some hiccups along the way.
Comparing that recent medium-term revenue trajectory with the industry's one-year growth forecast of 2.8% shows it's noticeably more attractive.
In light of this, it's peculiar that Nordic Flanges Group's P/S sits below the majority of other companies. It looks like most investors are not convinced the company can maintain its recent growth rates.
The Final Word
Nordic Flanges Group's recently weak share price has pulled its P/S back below other Machinery companies. Typically, we'd caution against reading too much into price-to-sales ratios when settling on investment decisions, though it can reveal plenty about what other market participants think about the company.
Our examination of Nordic Flanges Group revealed its three-year revenue trends aren't boosting its P/S anywhere near as much as we would have predicted, given they look better than current industry expectations. When we see strong revenue with faster-than-industry growth, we assume there are some significant underlying risks to the company's ability to make money which is applying downwards pressure on the P/S ratio. At least price risks look to be very low if recent medium-term revenue trends continue, but investors seem to think future revenue could see a lot of volatility.
You always need to take note of risks, for example - Nordic Flanges Group has 4 warning signs we think you should be aware of.
If companies with solid past earnings growth is up your alley, you may wish to see this free collection of other companies with strong earnings growth and low P/E ratios.
Valuation is complex, but we're here to simplify it.
Discover if Nordic Flanges Group might be undervalued or overvalued with our detailed analysis, featuring fair value estimates, potential risks, dividends, insider trades, and its financial condition.
Access Free AnalysisHave feedback on this article? Concerned about the content? Get in touch with us directly. Alternatively, email editorial-team (at) simplywallst.com.
This article by Simply Wall St is general in nature. We provide commentary based on historical data and analyst forecasts only using an unbiased methodology and our articles are not intended to be financial advice. It does not constitute a recommendation to buy or sell any stock, and does not take account of your objectives, or your financial situation. We aim to bring you long-term focused analysis driven by fundamental data. Note that our analysis may not factor in the latest price-sensitive company announcements or qualitative material. Simply Wall St has no position in any stocks mentioned.
About OM:NFGAB
Nordic Flanges Group
Produces and sells industrial flanges in Sweden, rest of the Nordic region, and internationally.
Good value with mediocre balance sheet.
Market Insights

Advertisement
Community Narratives
America Wants Homegrown Drones — Draganfly Is Ready to Deliver
Fair Value US$9.21|32.6% undervalued
JO
Community Contributor
Cheesecake Factory offers an enticing opportunity for long-term growth by leveraging new concepts
Fair Value US$73.83|25.6% undervalued
ZW
Community Contributor
Coca-Cola’s Intrinsic Value Set to Rise with Fed Rate Cut
Fair Value US$67.50|1.6% undervalued
AL
Community Contributor
Fully Permitted Gold Mine with 50 Baggers Potential 
Fair Value CA$41.00|98.2% undervalued
RO
Community Contributor