
Advertisement
- Sweden
- /
- Aerospace & Defense
- /
- OM:IVSO
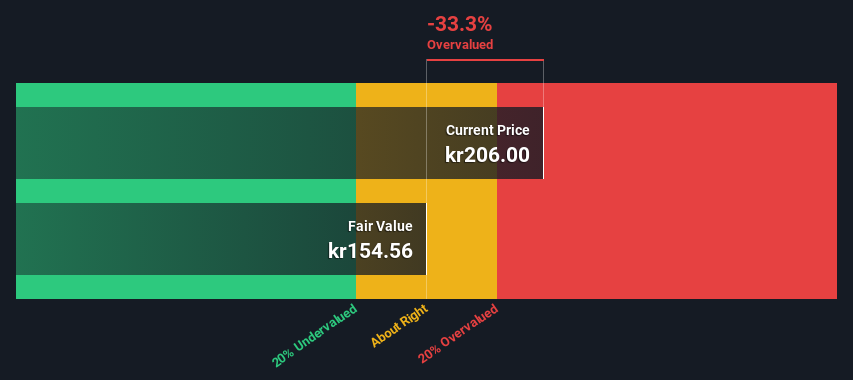
Invisio AB (publ) (STO:IVSO) Shares Could Be 33% Above Their Intrinsic Value Estimate

Key Insights
- The projected fair value for Invisio is kr155 based on 2 Stage Free Cash Flow to Equity
- Current share price of kr206 suggests Invisio is potentially 33% overvalued
- The kr238 analyst price target for IVSO is 54% more than our estimate of fair value
Today we'll do a simple run through of a valuation method used to estimate the attractiveness of Invisio AB (publ) (STO:IVSO) as an investment opportunity by taking the expected future cash flows and discounting them to their present value. One way to achieve this is by employing the Discounted Cash Flow (DCF) model. Models like these may appear beyond the comprehension of a lay person, but they're fairly easy to follow.
We would caution that there are many ways of valuing a company and, like the DCF, each technique has advantages and disadvantages in certain scenarios. For those who are keen learners of equity analysis, the Simply Wall St analysis model here may be something of interest to you.
Check out our latest analysis for Invisio
Step By Step Through The Calculation
We are going to use a two-stage DCF model, which, as the name states, takes into account two stages of growth. The first stage is generally a higher growth period which levels off heading towards the terminal value, captured in the second 'steady growth' period. To start off with, we need to estimate the next ten years of cash flows. Where possible we use analyst estimates, but when these aren't available we extrapolate the previous free cash flow (FCF) from the last estimate or reported value. We assume companies with shrinking free cash flow will slow their rate of shrinkage, and that companies with growing free cash flow will see their growth rate slow, over this period. We do this to reflect that growth tends to slow more in the early years than it does in later years.
Generally we assume that a dollar today is more valuable than a dollar in the future, so we discount the value of these future cash flows to their estimated value in today's dollars:
10-year free cash flow (FCF) estimate
| 2024 | 2025 | 2026 | 2027 | 2028 | 2029 | 2030 | 2031 | 2032 | 2033 | |
| Levered FCF (SEK, Millions) | kr190.0m | kr221.0m | kr243.0m | kr260.5m | kr274.2m | kr285.0m | kr293.5m | kr300.3m | kr305.9m | kr310.6m |
| Growth Rate Estimate Source | Analyst x1 | Analyst x1 | Est @ 9.95% | Est @ 7.20% | Est @ 5.28% | Est @ 3.93% | Est @ 2.98% | Est @ 2.32% | Est @ 1.86% | Est @ 1.54% |
| Present Value (SEK, Millions) Discounted @ 4.8% | kr181 | kr201 | kr211 | kr216 | kr217 | kr215 | kr212 | kr207 | kr201 | kr195 |
("Est" = FCF growth rate estimated by Simply Wall St)
Present Value of 10-year Cash Flow (PVCF) = kr2.1b
We now need to calculate the Terminal Value, which accounts for all the future cash flows after this ten year period. For a number of reasons a very conservative growth rate is used that cannot exceed that of a country's GDP growth. In this case we have used the 5-year average of the 10-year government bond yield (0.8%) to estimate future growth. In the same way as with the 10-year 'growth' period, we discount future cash flows to today's value, using a cost of equity of 4.8%.
Terminal Value (TV)= FCF2033 × (1 + g) ÷ (r – g) = kr311m× (1 + 0.8%) ÷ (4.8%– 0.8%) = kr7.8b
Present Value of Terminal Value (PVTV)= TV / (1 + r)10= kr7.8b÷ ( 1 + 4.8%)10= kr4.9b
The total value is the sum of cash flows for the next ten years plus the discounted terminal value, which results in the Total Equity Value, which in this case is kr7.0b. To get the intrinsic value per share, we divide this by the total number of shares outstanding. Relative to the current share price of kr206, the company appears reasonably expensive at the time of writing. Remember though, that this is just an approximate valuation, and like any complex formula - garbage in, garbage out.
The Assumptions
We would point out that the most important inputs to a discounted cash flow are the discount rate and of course the actual cash flows. Part of investing is coming up with your own evaluation of a company's future performance, so try the calculation yourself and check your own assumptions. The DCF also does not consider the possible cyclicality of an industry, or a company's future capital requirements, so it does not give a full picture of a company's potential performance. Given that we are looking at Invisio as potential shareholders, the cost of equity is used as the discount rate, rather than the cost of capital (or weighted average cost of capital, WACC) which accounts for debt. In this calculation we've used 4.8%, which is based on a levered beta of 0.800. Beta is a measure of a stock's volatility, compared to the market as a whole. We get our beta from the industry average beta of globally comparable companies, with an imposed limit between 0.8 and 2.0, which is a reasonable range for a stable business.
SWOT Analysis for Invisio
Strength
- Earnings growth over the past year exceeded the industry.
- Currently debt free.
Weakness
- Dividend is low compared to the top 25% of dividend payers in the Aerospace & Defense market.
- Expensive based on P/E ratio and estimated fair value.
Opportunity
- Annual earnings are forecast to grow faster than the Swedish market.
Threat
- Revenue is forecast to grow slower than 20% per year.
Looking Ahead:
Although the valuation of a company is important, it is only one of many factors that you need to assess for a company. The DCF model is not a perfect stock valuation tool. Preferably you'd apply different cases and assumptions and see how they would impact the company's valuation. If a company grows at a different rate, or if its cost of equity or risk free rate changes sharply, the output can look very different. What is the reason for the share price exceeding the intrinsic value? For Invisio, we've put together three essential factors you should assess:
- Financial Health: Does IVSO have a healthy balance sheet? Take a look at our free balance sheet analysis with six simple checks on key factors like leverage and risk.
- Future Earnings: How does IVSO's growth rate compare to its peers and the wider market? Dig deeper into the analyst consensus number for the upcoming years by interacting with our free analyst growth expectation chart.
- Other Solid Businesses: Low debt, high returns on equity and good past performance are fundamental to a strong business. Why not explore our interactive list of stocks with solid business fundamentals to see if there are other companies you may not have considered!
PS. The Simply Wall St app conducts a discounted cash flow valuation for every stock on the OM every day. If you want to find the calculation for other stocks just search here.
New: AI Stock Screener & Alerts
Our new AI Stock Screener scans the market every day to uncover opportunities.
• Dividend Powerhouses (3%+ Yield)
• Undervalued Small Caps with Insider Buying
• High growth Tech and AI Companies
Or build your own from over 50 metrics.
Have feedback on this article? Concerned about the content? Get in touch with us directly. Alternatively, email editorial-team (at) simplywallst.com.
This article by Simply Wall St is general in nature. We provide commentary based on historical data and analyst forecasts only using an unbiased methodology and our articles are not intended to be financial advice. It does not constitute a recommendation to buy or sell any stock, and does not take account of your objectives, or your financial situation. We aim to bring you long-term focused analysis driven by fundamental data. Note that our analysis may not factor in the latest price-sensitive company announcements or qualitative material. Simply Wall St has no position in any stocks mentioned.
About OM:IVSO
Invisio
Develops and sells communication and hearing protection systems for professionals in the defense, law enforcement, and security sectors in Sweden, Europe, North America, and internationally.
Flawless balance sheet with high growth potential.
Similar Companies
Market Insights


Advertisement
Community Narratives
Nike's Direct-to-Consumer Focus Will Drive Future Growth
Fair Value US$87.90|18.2% undervalued
UN
Community Contributor
Novo Nordisk will dominate GLP-1 market with Ozempic and Wegovy growth
Fair Value US$89.59|12.1% undervalued
BE
Community Contributor
Rheinmetall could get 20-25% of EU-NATO 3%-GDP defence spending
Fair Value €7.57k|82.4% undervalued
NO
Community Contributor