Advertisement
- Spain
- /
- Metals and Mining
- /
- BME:ACX
Acerinox And 2 Other European Stocks That May Be Priced Below Intrinsic Value

Simply Wall St
Reviewed by Simply Wall St
As the European markets navigate a mixed landscape, with the pan-European STOXX Europe 600 Index slightly lower amid global growth concerns and currency fluctuations, investors are increasingly on the lookout for opportunities that may be undervalued. In such an environment, identifying stocks priced below their intrinsic value can offer potential avenues for growth, particularly when broader economic indicators suggest resilience in sectors like retail and labor markets.
Top 10 Undervalued Stocks Based On Cash Flows In Europe
| Name | Current Price | Fair Value (Est) | Discount (Est) |
| Siemens Energy (XTRA:ENR) | €87.58 | €174.89 | 49.9% |
| Robit Oyj (HLSE:ROBIT) | €1.18 | €2.28 | 48.3% |
| Micro Systemation (OM:MSAB B) | SEK63.00 | SEK124.01 | 49.2% |
| DSV (CPSE:DSV) | DKK1352.50 | DKK2689.07 | 49.7% |
| cyan (XTRA:CYR) | €2.30 | €4.47 | 48.5% |
| Camurus (OM:CAMX) | SEK724.50 | SEK1416.78 | 48.9% |
| Atea (OB:ATEA) | NOK140.80 | NOK277.94 | 49.3% |
| Alfio Bardolla Training Group (BIT:ABTG) | €1.945 | €3.79 | 48.7% |
| adidas (XTRA:ADS) | €175.70 | €351.18 | 50% |
| Absolent Air Care Group (OM:ABSO) | SEK251.00 | SEK501.81 | 50% |
Let's take a closer look at a couple of our picks from the screened companies.
Acerinox (BME:ACX)
Overview: Acerinox, S.A. is a global company that manufactures, processes, and markets stainless steel products across various regions including Spain, the United States, Africa, Asia, and Europe with a market cap of approximately €2.67 billion.
Operations: The company's revenue is primarily derived from its Stainless Steel Business, which accounts for €4.18 billion, and High Performance Alloys, contributing €1.55 billion.
Estimated Discount To Fair Value: 35.6%
Acerinox is trading at a significant discount to its estimated fair value of €16.65, with current prices around €10.72, suggesting potential undervaluation based on cash flows. Despite a recent net loss of €17.54 million for the half year ending June 2025, earnings are forecast to grow significantly at 41.9% annually, outpacing the Spanish market's growth rate of 4.7%. However, debt coverage by operating cash flow remains a concern.
- Upon reviewing our latest growth report, Acerinox's projected financial performance appears quite optimistic.
- Click here to discover the nuances of Acerinox with our detailed financial health report.
FDJ United (ENXTPA:FDJU)
Overview: FDJ United operates in the gaming and distribution sector both in France and internationally, with a market cap of €5.16 billion.
Operations: The company generates revenue from its Lottery and Networked Sports Betting segment in France, totaling €2.09 billion.
Estimated Discount To Fair Value: 46.7%
FDJ United is trading at a substantial discount to its estimated fair value of €52.37, with current prices around €27.92, highlighting potential undervaluation based on cash flows. Despite a decline in net income to €135.7 million for H1 2025 from €212.7 million the previous year, earnings are forecast to grow at 13.07% annually, surpassing the French market's growth rate of 12.1%. However, profit margins have decreased and dividend coverage remains inadequate due to high debt levels.
- In light of our recent growth report, it seems possible that FDJ United's financial performance will exceed current levels.
- Get an in-depth perspective on FDJ United's balance sheet by reading our health report here.

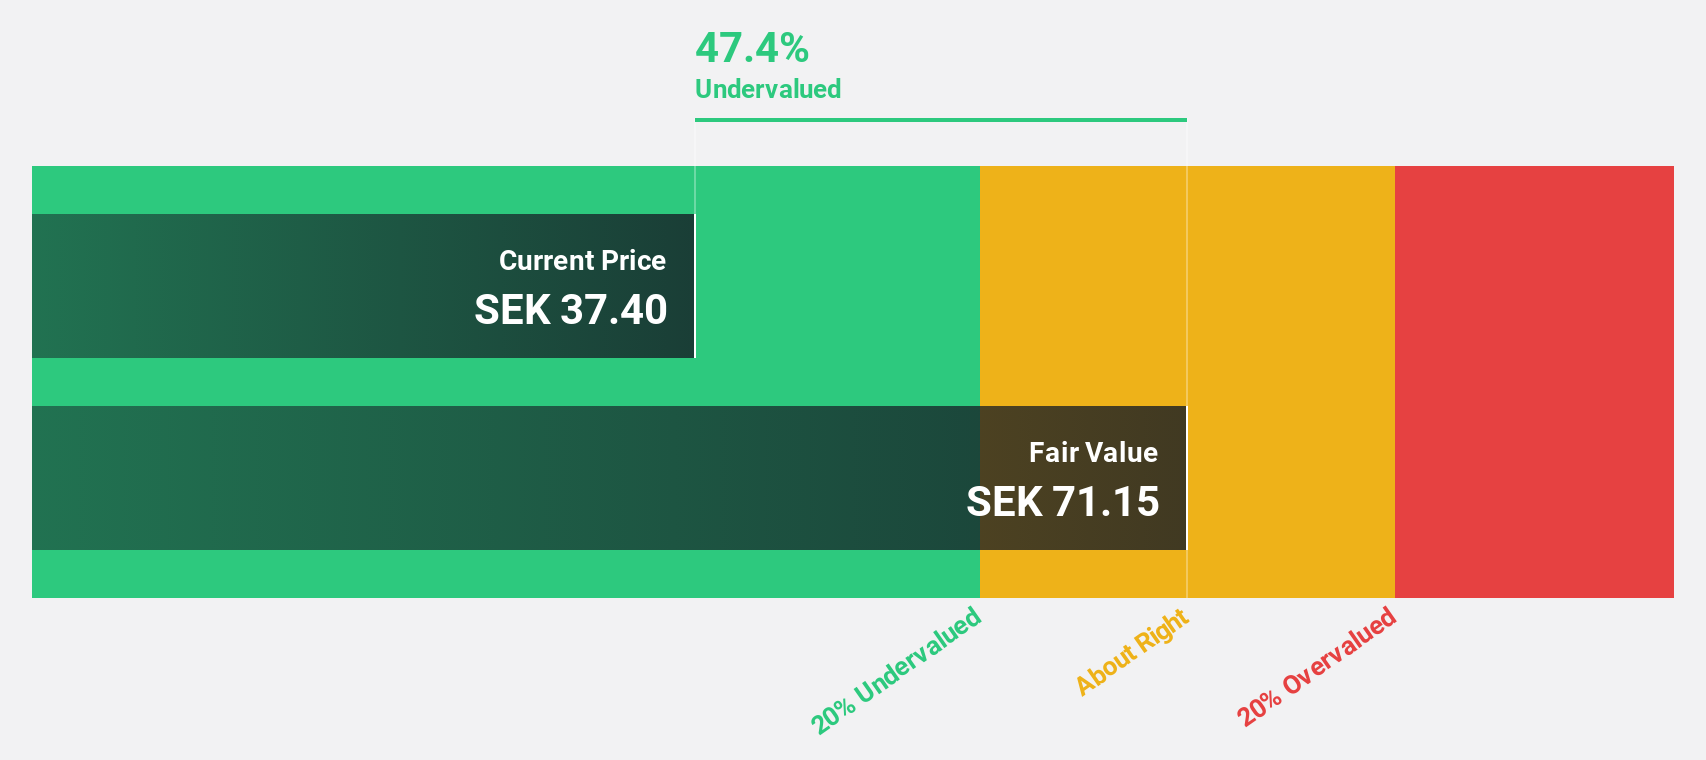
Fagerhult Group (OM:FAG)
Overview: Fagerhult Group AB, along with its subsidiaries, designs, manufactures, and markets professional lighting solutions globally with a market cap of SEK7.15 billion.
Operations: The company's revenue segments include Premium at SEK2.69 billion, Collection at SEK3.59 billion, Professional at SEK929.70 million, Infrastructure at SEK778.70 million, and Smart Solutions at SEK12.50 million.
Estimated Discount To Fair Value: 44.4%
Fagerhult Group's current trading price of SEK 40.55 is substantially below its estimated fair value of SEK 72.89, suggesting it may be undervalued based on cash flows. Despite a drop in net income to SEK 46.3 million for Q2 2025 from SEK 108.8 million the previous year, earnings are projected to grow significantly at 34.78% annually, outpacing the Swedish market's growth rate of 16.6%. However, profit margins have shrunk and dividend sustainability is questionable due to insufficient earnings coverage.
- Insights from our recent growth report point to a promising forecast for Fagerhult Group's business outlook.
- Navigate through the intricacies of Fagerhult Group with our comprehensive financial health report here.
Seize The Opportunity
- Click here to access our complete index of 216 Undervalued European Stocks Based On Cash Flows.
- Have you diversified into these companies? Leverage the power of Simply Wall St's portfolio to keep a close eye on market movements affecting your investments.
- Unlock the power of informed investing with Simply Wall St, your free guide to navigating stock markets worldwide.
Contemplating Other Strategies?
- Explore high-performing small cap companies that haven't yet garnered significant analyst attention.
- Diversify your portfolio with solid dividend payers offering reliable income streams to weather potential market turbulence.
- Fuel your portfolio with companies showing strong growth potential, backed by optimistic outlooks both from analysts and management.
This article by Simply Wall St is general in nature. We provide commentary based on historical data and analyst forecasts only using an unbiased methodology and our articles are not intended to be financial advice. It does not constitute a recommendation to buy or sell any stock, and does not take account of your objectives, or your financial situation. We aim to bring you long-term focused analysis driven by fundamental data. Note that our analysis may not factor in the latest price-sensitive company announcements or qualitative material. Simply Wall St has no position in any stocks mentioned.
New: Manage All Your Stock Portfolios in One Place
We've created the ultimate portfolio companion for stock investors, and it's free.
• Connect an unlimited number of Portfolios and see your total in one currency
• Be alerted to new Warning Signs or Risks via email or mobile
• Track the Fair Value of your stocks
Have feedback on this article? Concerned about the content? Get in touch with us directly. Alternatively, email editorial-team@simplywallst.com
About BME:ACX
Acerinox
Manufactures, process, and markets stainless steel products in Spain, the United States, Africa, Asia, Rest of Europe, and internationally.
Reasonable growth potential with proven track record.
Similar Companies
Market Insights

Advertisement
Community Narratives
A formidable player in AI and enterprise computing.
Fair Value US$210.00|12.2% overvalued
CO
Community Contributor
IREN's Bold Moves in Sustainable Bitcoin Mining & AI Data Centers
Fair Value US$72.52|17.1% undervalued
BL
Community Contributor
Cooling the Champions: The Aussie Tech Behind F1's Victories
Fair Value AU$12.40|38.1% undervalued
TR
Community Contributor