- Sweden
- /
- Trade Distributors
- /
- OM:BEIJ B
Does This Valuation Of Beijer Ref AB (publ) (STO:BEIJ B) Imply Investors Are Overpaying?


Key Insights
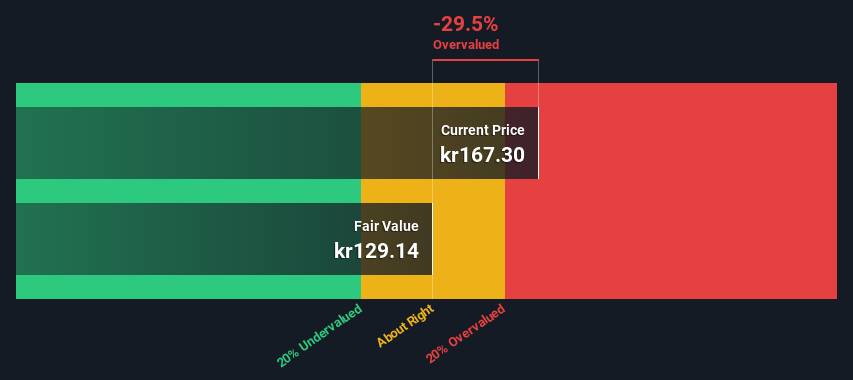
- Using the 2 Stage Free Cash Flow to Equity, Beijer Ref fair value estimate is kr129
- Beijer Ref's kr167 share price signals that it might be 30% overvalued
- Analyst price target for BEIJ B is kr194, which is 50% above our fair value estimate
Does the September share price for Beijer Ref AB (publ) (STO:BEIJ B) reflect what it's really worth? Today, we will estimate the stock's intrinsic value by taking the forecast future cash flows of the company and discounting them back to today's value. We will take advantage of the Discounted Cash Flow (DCF) model for this purpose. Models like these may appear beyond the comprehension of a lay person, but they're fairly easy to follow.
Companies can be valued in a lot of ways, so we would point out that a DCF is not perfect for every situation. If you still have some burning questions about this type of valuation, take a look at the Simply Wall St analysis model.
View our latest analysis for Beijer Ref
Crunching The Numbers
We are going to use a two-stage DCF model, which, as the name states, takes into account two stages of growth. The first stage is generally a higher growth period which levels off heading towards the terminal value, captured in the second 'steady growth' period. To start off with, we need to estimate the next ten years of cash flows. Where possible we use analyst estimates, but when these aren't available we extrapolate the previous free cash flow (FCF) from the last estimate or reported value. We assume companies with shrinking free cash flow will slow their rate of shrinkage, and that companies with growing free cash flow will see their growth rate slow, over this period. We do this to reflect that growth tends to slow more in the early years than it does in later years.
A DCF is all about the idea that a dollar in the future is less valuable than a dollar today, so we discount the value of these future cash flows to their estimated value in today's dollars:
10-year free cash flow (FCF) estimate
| 2025 | 2026 | 2027 | 2028 | 2029 | 2030 | 2031 | 2032 | 2033 | 2034 | |
| Levered FCF (SEK, Millions) | kr2.72b | kr3.09b | kr3.10b | kr3.11b | kr3.13b | kr3.16b | kr3.19b | kr3.22b | kr3.25b | kr3.28b |
| Growth Rate Estimate Source | Analyst x5 | Analyst x5 | Est @ 0.28% | Est @ 0.52% | Est @ 0.69% | Est @ 0.80% | Est @ 0.89% | Est @ 0.94% | Est @ 0.99% | Est @ 1.01% |
| Present Value (SEK, Millions) Discounted @ 5.6% | kr2.6k | kr2.8k | kr2.6k | kr2.5k | kr2.4k | kr2.3k | kr2.2k | kr2.1k | kr2.0k | kr1.9k |
("Est" = FCF growth rate estimated by Simply Wall St)
Present Value of 10-year Cash Flow (PVCF) = kr23b
We now need to calculate the Terminal Value, which accounts for all the future cash flows after this ten year period. For a number of reasons a very conservative growth rate is used that cannot exceed that of a country's GDP growth. In this case we have used the 5-year average of the 10-year government bond yield (1.1%) to estimate future growth. In the same way as with the 10-year 'growth' period, we discount future cash flows to today's value, using a cost of equity of 5.6%.
Terminal Value (TV)= FCF2034 × (1 + g) ÷ (r – g) = kr3.3b× (1 + 1.1%) ÷ (5.6%– 1.1%) = kr73b
Present Value of Terminal Value (PVTV)= TV / (1 + r)10= kr73b÷ ( 1 + 5.6%)10= kr42b
The total value, or equity value, is then the sum of the present value of the future cash flows, which in this case is kr65b. To get the intrinsic value per share, we divide this by the total number of shares outstanding. Compared to the current share price of kr167, the company appears slightly overvalued at the time of writing. The assumptions in any calculation have a big impact on the valuation, so it is better to view this as a rough estimate, not precise down to the last cent.
The Assumptions
The calculation above is very dependent on two assumptions. The first is the discount rate and the other is the cash flows. You don't have to agree with these inputs, I recommend redoing the calculations yourself and playing with them. The DCF also does not consider the possible cyclicality of an industry, or a company's future capital requirements, so it does not give a full picture of a company's potential performance. Given that we are looking at Beijer Ref as potential shareholders, the cost of equity is used as the discount rate, rather than the cost of capital (or weighted average cost of capital, WACC) which accounts for debt. In this calculation we've used 5.6%, which is based on a levered beta of 1.103. Beta is a measure of a stock's volatility, compared to the market as a whole. We get our beta from the industry average beta of globally comparable companies, with an imposed limit between 0.8 and 2.0, which is a reasonable range for a stable business.
SWOT Analysis for Beijer Ref
- Earnings growth over the past year exceeded the industry.
- Debt is not viewed as a risk.
- Dividend is low compared to the top 25% of dividend payers in the Trade Distributors market.
- Expensive based on P/E ratio and estimated fair value.
- Annual revenue is forecast to grow faster than the Swedish market.
- Annual earnings are forecast to grow slower than the Swedish market.
Looking Ahead:
Valuation is only one side of the coin in terms of building your investment thesis, and it is only one of many factors that you need to assess for a company. It's not possible to obtain a foolproof valuation with a DCF model. Instead the best use for a DCF model is to test certain assumptions and theories to see if they would lead to the company being undervalued or overvalued. For instance, if the terminal value growth rate is adjusted slightly, it can dramatically alter the overall result. Why is the intrinsic value lower than the current share price? For Beijer Ref, we've put together three essential aspects you should assess:
- Financial Health: Does BEIJ B have a healthy balance sheet? Take a look at our free balance sheet analysis with six simple checks on key factors like leverage and risk.
- Future Earnings: How does BEIJ B's growth rate compare to its peers and the wider market? Dig deeper into the analyst consensus number for the upcoming years by interacting with our free analyst growth expectation chart.
- Other High Quality Alternatives: Do you like a good all-rounder? Explore our interactive list of high quality stocks to get an idea of what else is out there you may be missing!
PS. The Simply Wall St app conducts a discounted cash flow valuation for every stock on the OM every day. If you want to find the calculation for other stocks just search here.
If you're looking to trade Beijer Ref, open an account with the lowest-cost platform trusted by professionals, Interactive Brokers.
With clients in over 200 countries and territories, and access to 160 markets, IBKR lets you trade stocks, options, futures, forex, bonds and funds from a single integrated account.
Enjoy no hidden fees, no account minimums, and FX conversion rates as low as 0.03%, far better than what most brokers offer.
Sponsored ContentValuation is complex, but we're here to simplify it.
Discover if Beijer Ref might be undervalued or overvalued with our detailed analysis, featuring fair value estimates, potential risks, dividends, insider trades, and its financial condition.
Access Free AnalysisHave feedback on this article? Concerned about the content? Get in touch with us directly. Alternatively, email editorial-team (at) simplywallst.com.
This article by Simply Wall St is general in nature. We provide commentary based on historical data and analyst forecasts only using an unbiased methodology and our articles are not intended to be financial advice. It does not constitute a recommendation to buy or sell any stock, and does not take account of your objectives, or your financial situation. We aim to bring you long-term focused analysis driven by fundamental data. Note that our analysis may not factor in the latest price-sensitive company announcements or qualitative material. Simply Wall St has no position in any stocks mentioned.
About OM:BEIJ B
Beijer Ref
Provides commercial and industrial refrigeration, heating, and air conditioning products worldwide.
Excellent balance sheet with limited growth.
Similar Companies
Market Insights

Community Narratives


