
Advertisement
- Sweden
- /
- Trade Distributors
- /
- OM:BEIJ B
Calculating The Intrinsic Value Of Beijer Ref AB (publ) (STO:BEIJ B)

Key Insights
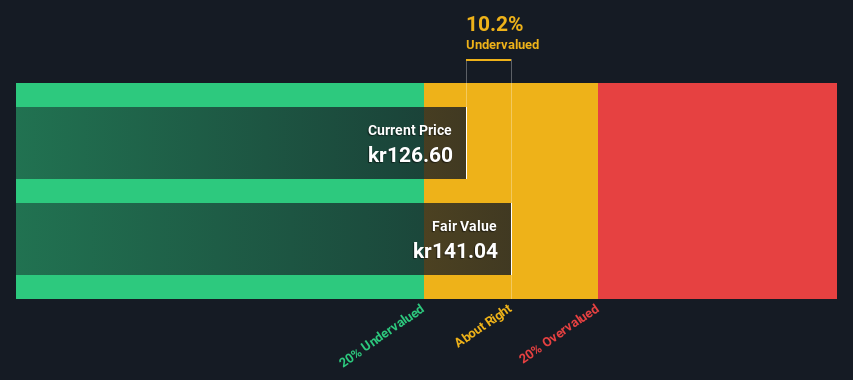
- The projected fair value for Beijer Ref is kr141 based on 2 Stage Free Cash Flow to Equity
- Current share price of kr127 suggests Beijer Ref is potentially trading close to its fair value
- Our fair value estimate is 7.3% lower than Beijer Ref's analyst price target of kr152
Today we will run through one way of estimating the intrinsic value of Beijer Ref AB (publ) (STO:BEIJ B) by taking the forecast future cash flows of the company and discounting them back to today's value. This will be done using the Discounted Cash Flow (DCF) model. Before you think you won't be able to understand it, just read on! It's actually much less complex than you'd imagine.
Remember though, that there are many ways to estimate a company's value, and a DCF is just one method. If you still have some burning questions about this type of valuation, take a look at the Simply Wall St analysis model.
View our latest analysis for Beijer Ref
The Method
We are going to use a two-stage DCF model, which, as the name states, takes into account two stages of growth. The first stage is generally a higher growth period which levels off heading towards the terminal value, captured in the second 'steady growth' period. To start off with, we need to estimate the next ten years of cash flows. Where possible we use analyst estimates, but when these aren't available we extrapolate the previous free cash flow (FCF) from the last estimate or reported value. We assume companies with shrinking free cash flow will slow their rate of shrinkage, and that companies with growing free cash flow will see their growth rate slow, over this period. We do this to reflect that growth tends to slow more in the early years than it does in later years.
Generally we assume that a dollar today is more valuable than a dollar in the future, so we discount the value of these future cash flows to their estimated value in today's dollars:
10-year free cash flow (FCF) estimate
| 2024 | 2025 | 2026 | 2027 | 2028 | 2029 | 2030 | 2031 | 2032 | 2033 | |
| Levered FCF (SEK, Millions) | kr2.88b | kr3.30b | kr3.61b | kr3.84b | kr4.03b | kr4.18b | kr4.29b | kr4.39b | kr4.46b | kr4.53b |
| Growth Rate Estimate Source | Analyst x2 | Analyst x2 | Est @ 9.10% | Est @ 6.60% | Est @ 4.86% | Est @ 3.63% | Est @ 2.78% | Est @ 2.18% | Est @ 1.76% | Est @ 1.47% |
| Present Value (SEK, Millions) Discounted @ 6.4% | kr2.7k | kr2.9k | kr3.0k | kr3.0k | kr3.0k | kr2.9k | kr2.8k | kr2.7k | kr2.6k | kr2.4k |
("Est" = FCF growth rate estimated by Simply Wall St)
Present Value of 10-year Cash Flow (PVCF) = kr28b
After calculating the present value of future cash flows in the initial 10-year period, we need to calculate the Terminal Value, which accounts for all future cash flows beyond the first stage. For a number of reasons a very conservative growth rate is used that cannot exceed that of a country's GDP growth. In this case we have used the 5-year average of the 10-year government bond yield (0.8%) to estimate future growth. In the same way as with the 10-year 'growth' period, we discount future cash flows to today's value, using a cost of equity of 6.4%.
Terminal Value (TV)= FCF2033 × (1 + g) ÷ (r – g) = kr4.5b× (1 + 0.8%) ÷ (6.4%– 0.8%) = kr81b
Present Value of Terminal Value (PVTV)= TV / (1 + r)10= kr81b÷ ( 1 + 6.4%)10= kr44b
The total value is the sum of cash flows for the next ten years plus the discounted terminal value, which results in the Total Equity Value, which in this case is kr71b. To get the intrinsic value per share, we divide this by the total number of shares outstanding. Relative to the current share price of kr127, the company appears about fair value at a 10% discount to where the stock price trades currently. The assumptions in any calculation have a big impact on the valuation, so it is better to view this as a rough estimate, not precise down to the last cent.
The Assumptions
The calculation above is very dependent on two assumptions. The first is the discount rate and the other is the cash flows. If you don't agree with these result, have a go at the calculation yourself and play with the assumptions. The DCF also does not consider the possible cyclicality of an industry, or a company's future capital requirements, so it does not give a full picture of a company's potential performance. Given that we are looking at Beijer Ref as potential shareholders, the cost of equity is used as the discount rate, rather than the cost of capital (or weighted average cost of capital, WACC) which accounts for debt. In this calculation we've used 6.4%, which is based on a levered beta of 1.125. Beta is a measure of a stock's volatility, compared to the market as a whole. We get our beta from the industry average beta of globally comparable companies, with an imposed limit between 0.8 and 2.0, which is a reasonable range for a stable business.
SWOT Analysis for Beijer Ref
Strength
- Earnings growth over the past year exceeded the industry.
- Debt is well covered by earnings.
Weakness
- Dividend is low compared to the top 25% of dividend payers in the Trade Distributors market.
- Shareholders have been diluted in the past year.
Opportunity
- Annual earnings are forecast to grow faster than the Swedish market.
- Current share price is below our estimate of fair value.
Threat
- Debt is not well covered by operating cash flow.
- Revenue is forecast to grow slower than 20% per year.
Next Steps:
Although the valuation of a company is important, it ideally won't be the sole piece of analysis you scrutinize for a company. The DCF model is not a perfect stock valuation tool. Preferably you'd apply different cases and assumptions and see how they would impact the company's valuation. If a company grows at a different rate, or if its cost of equity or risk free rate changes sharply, the output can look very different. For Beijer Ref, we've put together three pertinent aspects you should further research:
- Risks: Take risks, for example - Beijer Ref has 1 warning sign we think you should be aware of.
- Future Earnings: How does BEIJ B's growth rate compare to its peers and the wider market? Dig deeper into the analyst consensus number for the upcoming years by interacting with our free analyst growth expectation chart.
- Other Solid Businesses: Low debt, high returns on equity and good past performance are fundamental to a strong business. Why not explore our interactive list of stocks with solid business fundamentals to see if there are other companies you may not have considered!
PS. The Simply Wall St app conducts a discounted cash flow valuation for every stock on the OM every day. If you want to find the calculation for other stocks just search here.
Valuation is complex, but we're here to simplify it.
Discover if Beijer Ref might be undervalued or overvalued with our detailed analysis, featuring fair value estimates, potential risks, dividends, insider trades, and its financial condition.
Access Free AnalysisHave feedback on this article? Concerned about the content? Get in touch with us directly. Alternatively, email editorial-team (at) simplywallst.com.
This article by Simply Wall St is general in nature. We provide commentary based on historical data and analyst forecasts only using an unbiased methodology and our articles are not intended to be financial advice. It does not constitute a recommendation to buy or sell any stock, and does not take account of your objectives, or your financial situation. We aim to bring you long-term focused analysis driven by fundamental data. Note that our analysis may not factor in the latest price-sensitive company announcements or qualitative material. Simply Wall St has no position in any stocks mentioned.
About OM:BEIJ B
Beijer Ref
Provides refrigeration, heating, and air conditioning solutions worldwide.
Flawless balance sheet with moderate growth potential.
Similar Companies
Market Insights


Advertisement
Community Narratives
Nike's Direct-to-Consumer Focus Will Drive Future Growth
Fair Value US$87.90|18.2% undervalued
UN
Community Contributor
Novo Nordisk will dominate GLP-1 market with Ozempic and Wegovy growth
Fair Value US$89.59|12.1% undervalued
BE
Community Contributor
Rheinmetall could get 20-25% of EU-NATO 3%-GDP defence spending
Fair Value €7.57k|82.4% undervalued
NO
Community Contributor