Does The Market Have A Low Tolerance For KABE Group AB (publ.)'s (STO:KABE B) Mixed Fundamentals?

It is hard to get excited after looking at KABE Group AB (publ.)'s (STO:KABE B) recent performance, when its stock has declined 10% over the past month. We, however decided to study the company's financials to determine if they have got anything to do with the price decline. Long-term fundamentals are usually what drive market outcomes, so it's worth paying close attention. Particularly, we will be paying attention to KABE Group AB (publ.)'s ROE today.
Return on equity or ROE is a key measure used to assess how efficiently a company's management is utilizing the company's capital. In short, ROE shows the profit each dollar generates with respect to its shareholder investments.
Check out our latest analysis for KABE Group AB (publ.)
How Do You Calculate Return On Equity?
Return on equity can be calculated by using the formula:
Return on Equity = Net Profit (from continuing operations) ÷ Shareholders' Equity
So, based on the above formula, the ROE for KABE Group AB (publ.) is:
4.9% = kr56m ÷ kr1.1b (Based on the trailing twelve months to September 2020).
The 'return' is the yearly profit. So, this means that for every SEK1 of its shareholder's investments, the company generates a profit of SEK0.05.
What Has ROE Got To Do With Earnings Growth?
So far, we've learned that ROE is a measure of a company's profitability. We now need to evaluate how much profit the company reinvests or "retains" for future growth which then gives us an idea about the growth potential of the company. Assuming everything else remains unchanged, the higher the ROE and profit retention, the higher the growth rate of a company compared to companies that don't necessarily bear these characteristics.
A Side By Side comparison of KABE Group AB (publ.)'s Earnings Growth And 4.9% ROE
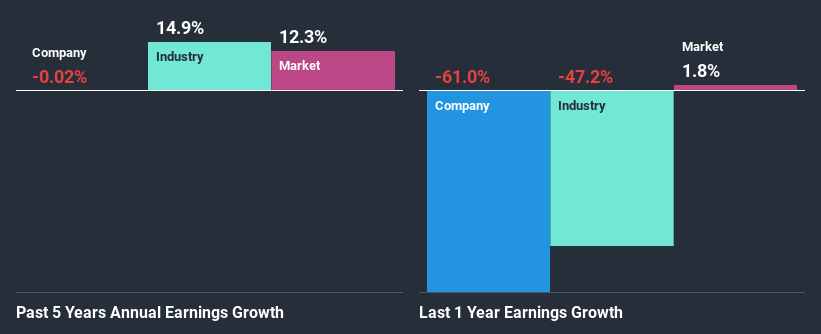
At first glance, KABE Group AB (publ.)'s ROE doesn't look very promising. Yet, a closer study shows that the company's ROE is similar to the industry average of 5.0%. Still, KABE Group AB (publ.) has seen a flat net income growth over the past five years. Bear in mind, the company's ROE is not very high. So that could also be one of the reasons behind the company's flat growth in earnings.
As a next step, we compared KABE Group AB (publ.)'s net income growth with the industry and discovered that the industry saw an average growth of 2.4% in the same period.
The basis for attaching value to a company is, to a great extent, tied to its earnings growth. The investor should try to establish if the expected growth or decline in earnings, whichever the case may be, is priced in. Doing so will help them establish if the stock's future looks promising or ominous. One good indicator of expected earnings growth is the P/E ratio which determines the price the market is willing to pay for a stock based on its earnings prospects. So, you may want to check if KABE Group AB (publ.) is trading on a high P/E or a low P/E, relative to its industry.
Is KABE Group AB (publ.) Making Efficient Use Of Its Profits?
While the company did pay out a portion of its dividend in the past, it currently doesn't pay a dividend. We infer that the company has been reinvesting all of its profits to grow its business.
Conclusion
In total, we're a bit ambivalent about KABE Group AB (publ.)'s performance. While the company does have a high rate of reinvestment, the low ROE means that all that reinvestment is not reaping any benefit to its investors, and moreover, its having a negative impact on the earnings growth. Up till now, we've only made a short study of the company's growth data. You can do your own research on KABE Group AB (publ.) and see how it has performed in the past by looking at this FREE detailed graph of past earnings, revenue and cash flows.
If you’re looking to trade KABE Group AB (publ.), open an account with the lowest-cost* platform trusted by professionals, Interactive Brokers. Their clients from over 200 countries and territories trade stocks, options, futures, forex, bonds and funds worldwide from a single integrated account. Promoted
Mobile Infrastructure for Defense and Disaster
The next wave in robotics isn't humanoid. Its fully autonomous towers delivering 5G, ISR, and radar in under 30 minutes, anywhere.
Get the investor briefing before the next round of contracts
Sponsored On Behalf of CiTechValuation is complex, but we're here to simplify it.
Discover if KABE Group AB (publ.) might be undervalued or overvalued with our detailed analysis, featuring fair value estimates, potential risks, dividends, insider trades, and its financial condition.
Access Free AnalysisThis article by Simply Wall St is general in nature. It does not constitute a recommendation to buy or sell any stock, and does not take account of your objectives, or your financial situation. We aim to bring you long-term focused analysis driven by fundamental data. Note that our analysis may not factor in the latest price-sensitive company announcements or qualitative material. Simply Wall St has no position in any stocks mentioned.
*Interactive Brokers Rated Lowest Cost Broker by StockBrokers.com Annual Online Review 2020
Have feedback on this article? Concerned about the content? Get in touch with us directly. Alternatively, email editorial-team@simplywallst.com.
About OM:KABE B
KABE Group AB (publ.)
Engages in the construction and sale of caravans, motorhomes, and camping accessories in Sweden, the United Kingdom, Germany, Norway, Finland, Denmark, Poland, and internationally.
Excellent balance sheet average dividend payer.
Similar Companies
Market Insights

Weekly Picks

THE KINGDOM OF BROWN GOODS: WHY MGPI IS BEING CRUSHED BY INVENTORY & PRIMED FOR RESURRECTION


Why Vertical Aerospace (NYSE: EVTL) is Worth Possibly Over 13x its Current Price


The Quiet Giant That Became AI’s Power Grid
Recently Updated Narratives


A tech powerhouse quietly powering the world’s AI infrastructure.


Keppel DC REIT (SGX: AJBU) is a resilient gem in the data center space.
Why Vertical Aerospace (NYSE: EVTL) is Worth Possibly Over 13x its Current Price
Popular Narratives

MicroVision will explode future revenue by 380.37% with a vision towards success


Crazy Undervalued 42 Baggers Silver Play (Active & Running Mine)


