- Saudi Arabia
- /
- Retail Distributors
- /
- SASE:4051
Baazeem Trading (TADAWUL:9503) Has Rewarded Shareholders With An Exceptional 341% Total Return On Their Investment


The worst result, after buying shares in a company (assuming no leverage), would be if you lose all the money you put in. But when you pick a company that is really flourishing, you can make more than 100%. For instance the Baazeem Trading Co. (TADAWUL:9503) share price is 276% higher than it was three years ago. How nice for those who held the stock! Also pleasing for shareholders was the 67% gain in the last three months.
Check out our latest analysis for Baazeem Trading
While the efficient markets hypothesis continues to be taught by some, it has been proven that markets are over-reactive dynamic systems, and investors are not always rational. One flawed but reasonable way to assess how sentiment around a company has changed is to compare the earnings per share (EPS) with the share price.
Over the last three years, Baazeem Trading failed to grow earnings per share, which fell 6.4% (annualized).
This means it's unlikely the market is judging the company based on earnings growth. Given this situation, it makes sense to look at other metrics too.
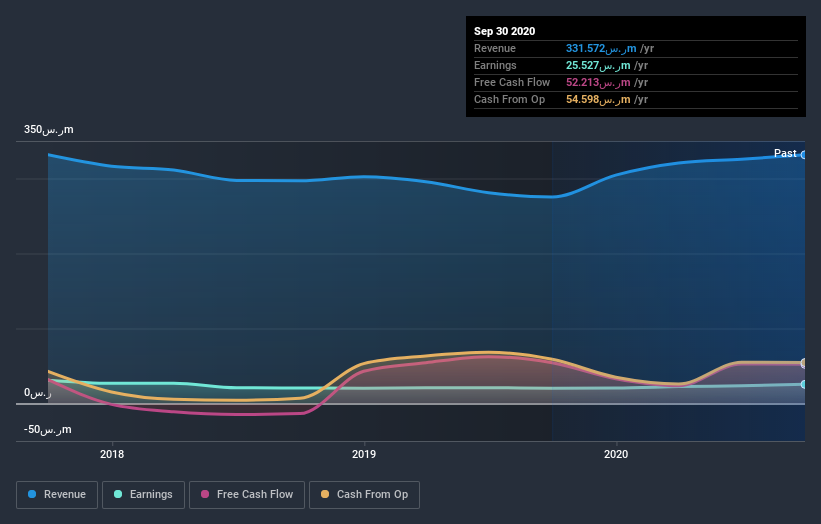
Languishing at just 1.6%, we doubt the dividend is doing much to prop up the share price. We severely doubt anyone is particularly impressed with the modest 0.3% three-year revenue growth rate. So truth be told we can't see an easy explanation for the share price action, but perhaps you can...
You can see how earnings and revenue have changed over time in the image below (click on the chart to see the exact values).
If you are thinking of buying or selling Baazeem Trading stock, you should check out this FREE detailed report on its balance sheet.
What About Dividends?
As well as measuring the share price return, investors should also consider the total shareholder return (TSR). The TSR is a return calculation that accounts for the value of cash dividends (assuming that any dividend received was reinvested) and the calculated value of any discounted capital raisings and spin-offs. Arguably, the TSR gives a more comprehensive picture of the return generated by a stock. As it happens, Baazeem Trading's TSR for the last 3 years was 341%, which exceeds the share price return mentioned earlier. The dividends paid by the company have thusly boosted the total shareholder return.
A Different Perspective
We're pleased to report that Baazeem Trading rewarded shareholders with a total shareholder return of 143% over the last year. That includes the value of the dividend. That gain actually surpasses the 64% TSR it generated (per year) over three years. The improving returns to shareholders suggests the stock is becoming more popular with time. It's always interesting to track share price performance over the longer term. But to understand Baazeem Trading better, we need to consider many other factors. Case in point: We've spotted 2 warning signs for Baazeem Trading you should be aware of, and 1 of them makes us a bit uncomfortable.
If you would prefer to check out another company -- one with potentially superior financials -- then do not miss this free list of companies that have proven they can grow earnings.
Please note, the market returns quoted in this article reflect the market weighted average returns of stocks that currently trade on SA exchanges.
If you’re looking to trade Baazeem Trading, open an account with the lowest-cost* platform trusted by professionals, Interactive Brokers. Their clients from over 200 countries and territories trade stocks, options, futures, forex, bonds and funds worldwide from a single integrated account. Promoted
If you're looking to trade Baazeem Trading, open an account with the lowest-cost platform trusted by professionals, Interactive Brokers.
With clients in over 200 countries and territories, and access to 160 markets, IBKR lets you trade stocks, options, futures, forex, bonds and funds from a single integrated account.
Enjoy no hidden fees, no account minimums, and FX conversion rates as low as 0.03%, far better than what most brokers offer.
Sponsored ContentValuation is complex, but we're here to simplify it.
Discover if Baazeem Trading might be undervalued or overvalued with our detailed analysis, featuring fair value estimates, potential risks, dividends, insider trades, and its financial condition.
Access Free AnalysisThis article by Simply Wall St is general in nature. It does not constitute a recommendation to buy or sell any stock, and does not take account of your objectives, or your financial situation. We aim to bring you long-term focused analysis driven by fundamental data. Note that our analysis may not factor in the latest price-sensitive company announcements or qualitative material. Simply Wall St has no position in any stocks mentioned.
*Interactive Brokers Rated Lowest Cost Broker by StockBrokers.com Annual Online Review 2020
Have feedback on this article? Concerned about the content? Get in touch with us directly. Alternatively, email editorial-team (at) simplywallst.com.
About SASE:4051
Flawless balance sheet with acceptable track record.
Market Insights

Community Narratives


