- Saudi Arabia
- /
- Chemicals
- /
- SASE:2310
Pulling back 3.9% this week, Sahara International Petrochemical's TADAWUL:2310) five-year decline in earnings may be coming into investors focus


Generally speaking the aim of active stock picking is to find companies that provide returns that are superior to the market average. And while active stock picking involves risks (and requires diversification) it can also provide excess returns. For example, long term Sahara International Petrochemical Company (TADAWUL:2310) shareholders have enjoyed a 65% share price rise over the last half decade, well in excess of the market return of around 28% (not including dividends).
While this past week has detracted from the company's five-year return, let's look at the recent trends of the underlying business and see if the gains have been in alignment.
View our latest analysis for Sahara International Petrochemical
To quote Buffett, 'Ships will sail around the world but the Flat Earth Society will flourish. There will continue to be wide discrepancies between price and value in the marketplace...' One imperfect but simple way to consider how the market perception of a company has shifted is to compare the change in the earnings per share (EPS) with the share price movement.
Sahara International Petrochemical's earnings per share are down 7.0% per year, despite strong share price performance over five years.
This means it's unlikely the market is judging the company based on earnings growth. Because earnings per share don't seem to match up with the share price, we'll take a look at other metrics instead.
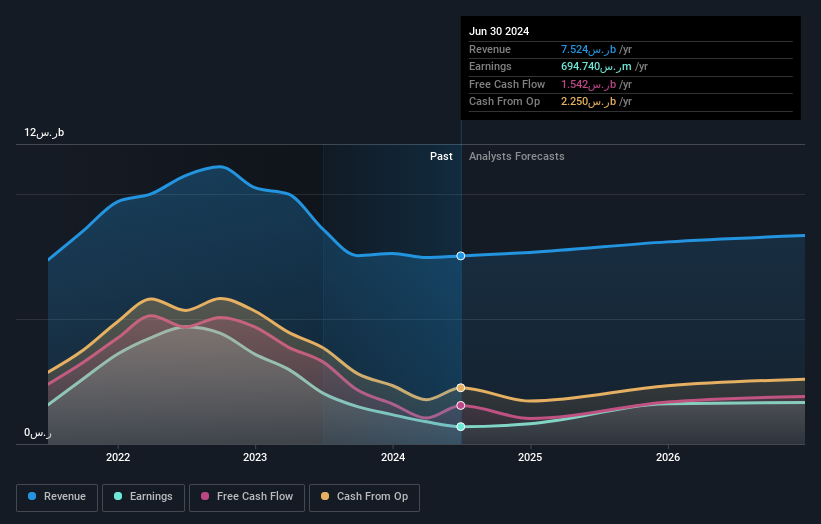
In contrast revenue growth of 11% per year is probably viewed as evidence that Sahara International Petrochemical is growing, a real positive. It's quite possible that management are prioritizing revenue growth over EPS growth at the moment.
The company's revenue and earnings (over time) are depicted in the image below (click to see the exact numbers).
Take a more thorough look at Sahara International Petrochemical's financial health with this free report on its balance sheet.
What About Dividends?
It is important to consider the total shareholder return, as well as the share price return, for any given stock. Whereas the share price return only reflects the change in the share price, the TSR includes the value of dividends (assuming they were reinvested) and the benefit of any discounted capital raising or spin-off. Arguably, the TSR gives a more comprehensive picture of the return generated by a stock. In the case of Sahara International Petrochemical, it has a TSR of 117% for the last 5 years. That exceeds its share price return that we previously mentioned. This is largely a result of its dividend payments!
A Different Perspective
While the broader market lost about 7.3% in the twelve months, Sahara International Petrochemical shareholders did even worse, losing 21% (even including dividends). Having said that, it's inevitable that some stocks will be oversold in a falling market. The key is to keep your eyes on the fundamental developments. Longer term investors wouldn't be so upset, since they would have made 17%, each year, over five years. It could be that the recent sell-off is an opportunity, so it may be worth checking the fundamental data for signs of a long term growth trend. It's always interesting to track share price performance over the longer term. But to understand Sahara International Petrochemical better, we need to consider many other factors. Even so, be aware that Sahara International Petrochemical is showing 2 warning signs in our investment analysis , you should know about...
For those who like to find winning investments this free list of undervalued companies with recent insider purchasing, could be just the ticket.
Please note, the market returns quoted in this article reflect the market weighted average returns of stocks that currently trade on Saudi exchanges.
New: Manage All Your Stock Portfolios in One Place
We've created the ultimate portfolio companion for stock investors, and it's free.
• Connect an unlimited number of Portfolios and see your total in one currency
• Be alerted to new Warning Signs or Risks via email or mobile
• Track the Fair Value of your stocks
Have feedback on this article? Concerned about the content? Get in touch with us directly. Alternatively, email editorial-team (at) simplywallst.com.
This article by Simply Wall St is general in nature. We provide commentary based on historical data and analyst forecasts only using an unbiased methodology and our articles are not intended to be financial advice. It does not constitute a recommendation to buy or sell any stock, and does not take account of your objectives, or your financial situation. We aim to bring you long-term focused analysis driven by fundamental data. Note that our analysis may not factor in the latest price-sensitive company announcements or qualitative material. Simply Wall St has no position in any stocks mentioned.
About SASE:2310
Sahara International Petrochemical
Owns, establishes, operates, and manages industrial projects related to chemical and petrochemical industries in the Kingdom of Saudi Arabia.
Flawless balance sheet and good value.
Similar Companies
Market Insights

Community Narratives


