
Advertisement
- Saudi Arabia
- /
- Metals and Mining
- /
- SASE:1211
Estimating The Intrinsic Value Of Saudi Arabian Mining Company (Ma'aden) (TADAWUL:1211)

Key Insights
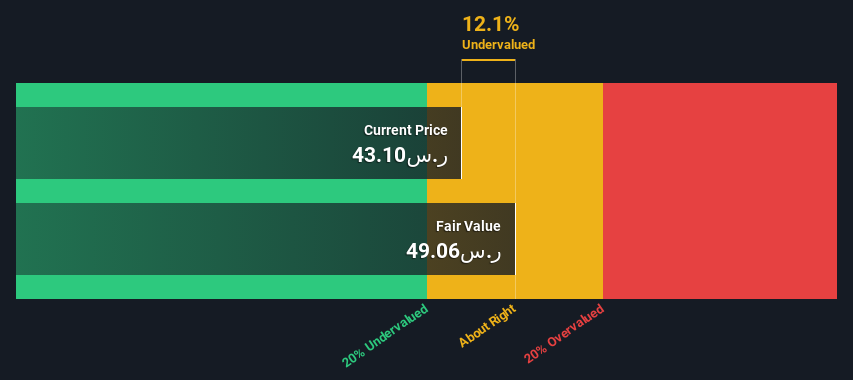
- Using the 2 Stage Free Cash Flow to Equity, Saudi Arabian Mining Company (Ma'aden) fair value estimate is ر.س49.06
- Current share price of ر.س43.10 suggests Saudi Arabian Mining Company (Ma'aden) is potentially trading close to its fair value
- The ر.س34.32 analyst price target for 1211 is 30% less than our estimate of fair value
In this article we are going to estimate the intrinsic value of Saudi Arabian Mining Company (Ma'aden) (TADAWUL:1211) by taking the expected future cash flows and discounting them to today's value. This will be done using the Discounted Cash Flow (DCF) model. There's really not all that much to it, even though it might appear quite complex.
Companies can be valued in a lot of ways, so we would point out that a DCF is not perfect for every situation. For those who are keen learners of equity analysis, the Simply Wall St analysis model here may be something of interest to you.
View our latest analysis for Saudi Arabian Mining Company (Ma'aden)
The Calculation
We use what is known as a 2-stage model, which simply means we have two different periods of growth rates for the company's cash flows. Generally the first stage is higher growth, and the second stage is a lower growth phase. To start off with, we need to estimate the next ten years of cash flows. Where possible we use analyst estimates, but when these aren't available we extrapolate the previous free cash flow (FCF) from the last estimate or reported value. We assume companies with shrinking free cash flow will slow their rate of shrinkage, and that companies with growing free cash flow will see their growth rate slow, over this period. We do this to reflect that growth tends to slow more in the early years than it does in later years.
Generally we assume that a dollar today is more valuable than a dollar in the future, so we need to discount the sum of these future cash flows to arrive at a present value estimate:
10-year free cash flow (FCF) forecast
| 2024 | 2025 | 2026 | 2027 | 2028 | 2029 | 2030 | 2031 | 2032 | 2033 | |
| Levered FCF (SAR, Millions) | ر.س7.61b | ر.س6.71b | ر.س15.0b | ر.س18.9b | ر.س22.9b | ر.س26.9b | ر.س30.8b | ر.س34.9b | ر.س39.0b | ر.س43.3b |
| Growth Rate Estimate Source | Analyst x3 | Analyst x2 | Analyst x1 | Est @ 25.97% | Est @ 20.88% | Est @ 17.31% | Est @ 14.82% | Est @ 13.07% | Est @ 11.84% | Est @ 10.99% |
| Present Value (SAR, Millions) Discounted @ 18% | ر.س6.4k | ر.س4.8k | ر.س9.1k | ر.س9.7k | ر.س9.9k | ر.س9.8k | ر.س9.6k | ر.س9.1k | ر.س8.6k | ر.س8.1k |
("Est" = FCF growth rate estimated by Simply Wall St)
Present Value of 10-year Cash Flow (PVCF) = ر.س85b
We now need to calculate the Terminal Value, which accounts for all the future cash flows after this ten year period. The Gordon Growth formula is used to calculate Terminal Value at a future annual growth rate equal to the 5-year average of the 10-year government bond yield of 9.0%. We discount the terminal cash flows to today's value at a cost of equity of 18%.
Terminal Value (TV)= FCF2033 × (1 + g) ÷ (r – g) = ر.س43b× (1 + 9.0%) ÷ (18%– 9.0%) = ر.س511b
Present Value of Terminal Value (PVTV)= TV / (1 + r)10= ر.س511b÷ ( 1 + 18%)10= ر.س96b
The total value is the sum of cash flows for the next ten years plus the discounted terminal value, which results in the Total Equity Value, which in this case is ر.س181b. In the final step we divide the equity value by the number of shares outstanding. Compared to the current share price of ر.س43.1, the company appears about fair value at a 12% discount to where the stock price trades currently. Remember though, that this is just an approximate valuation, and like any complex formula - garbage in, garbage out.
The Assumptions
Now the most important inputs to a discounted cash flow are the discount rate, and of course, the actual cash flows. Part of investing is coming up with your own evaluation of a company's future performance, so try the calculation yourself and check your own assumptions. The DCF also does not consider the possible cyclicality of an industry, or a company's future capital requirements, so it does not give a full picture of a company's potential performance. Given that we are looking at Saudi Arabian Mining Company (Ma'aden) as potential shareholders, the cost of equity is used as the discount rate, rather than the cost of capital (or weighted average cost of capital, WACC) which accounts for debt. In this calculation we've used 18%, which is based on a levered beta of 1.289. Beta is a measure of a stock's volatility, compared to the market as a whole. We get our beta from the industry average beta of globally comparable companies, with an imposed limit between 0.8 and 2.0, which is a reasonable range for a stable business.
SWOT Analysis for Saudi Arabian Mining Company (Ma'aden)
Strength
- Earnings growth over the past year exceeded the industry.
- Debt is well covered by earnings and cashflows.
Weakness
- Earnings growth over the past year is below its 5-year average.
Opportunity
- Current share price is below our estimate of fair value.
Threat
- Annual earnings are forecast to decline for the next 3 years.
Next Steps:
Although the valuation of a company is important, it is only one of many factors that you need to assess for a company. The DCF model is not a perfect stock valuation tool. Instead the best use for a DCF model is to test certain assumptions and theories to see if they would lead to the company being undervalued or overvalued. For example, changes in the company's cost of equity or the risk free rate can significantly impact the valuation. For Saudi Arabian Mining Company (Ma'aden), we've compiled three further items you should assess:
- Risks: For example, we've discovered 2 warning signs for Saudi Arabian Mining Company (Ma'aden) (1 is significant!) that you should be aware of before investing here.
- Future Earnings: How does 1211's growth rate compare to its peers and the wider market? Dig deeper into the analyst consensus number for the upcoming years by interacting with our free analyst growth expectation chart.
- Other Solid Businesses: Low debt, high returns on equity and good past performance are fundamental to a strong business. Why not explore our interactive list of stocks with solid business fundamentals to see if there are other companies you may not have considered!
PS. Simply Wall St updates its DCF calculation for every Saudi stock every day, so if you want to find the intrinsic value of any other stock just search here.
New: Manage All Your Stock Portfolios in One Place
We've created the ultimate portfolio companion for stock investors, and it's free.
• Connect an unlimited number of Portfolios and see your total in one currency
• Be alerted to new Warning Signs or Risks via email or mobile
• Track the Fair Value of your stocks
Have feedback on this article? Concerned about the content? Get in touch with us directly. Alternatively, email editorial-team (at) simplywallst.com.
This article by Simply Wall St is general in nature. We provide commentary based on historical data and analyst forecasts only using an unbiased methodology and our articles are not intended to be financial advice. It does not constitute a recommendation to buy or sell any stock, and does not take account of your objectives, or your financial situation. We aim to bring you long-term focused analysis driven by fundamental data. Note that our analysis may not factor in the latest price-sensitive company announcements or qualitative material. Simply Wall St has no position in any stocks mentioned.
About SASE:1211
Saudi Arabian Mining Company (Ma'aden)
Operates as a mining and metals company in the Kingdom of Saudi Arabia, India, Pakistan, Bangladesh, Singapore, Korea, the United States, Europe, Australia, Brazil, Africa, GCC, and internationally.
Excellent balance sheet with reasonable growth potential.
Similar Companies
Market Insights


Advertisement
Community Narratives
Nike's Direct-to-Consumer Focus Will Drive Future Growth
Fair Value US$87.90|18.2% undervalued
UN
Community Contributor
Novo Nordisk will dominate GLP-1 market with Ozempic and Wegovy growth
Fair Value US$89.59|12.1% undervalued
BE
Community Contributor
Rheinmetall could get 20-25% of EU-NATO 3%-GDP defence spending
Fair Value €7.57k|82.8% undervalued
NO
Community Contributor