- Saudi Arabia
- /
- Healthcare Services
- /
- SASE:4005
Calculating The Fair Value Of National Medical Care Company (TADAWUL:4005)


How far off is National Medical Care Company (TADAWUL:4005) from its intrinsic value? Using the most recent financial data, we'll take a look at whether the stock is fairly priced by taking the forecast future cash flows of the company and discounting them back to today's value. We will take advantage of the Discounted Cash Flow (DCF) model for this purpose. There's really not all that much to it, even though it might appear quite complex.
Companies can be valued in a lot of ways, so we would point out that a DCF is not perfect for every situation. If you still have some burning questions about this type of valuation, take a look at the Simply Wall St analysis model.
Check out our latest analysis for National Medical Care
The model
We're using the 2-stage growth model, which simply means we take in account two stages of company's growth. In the initial period the company may have a higher growth rate and the second stage is usually assumed to have a stable growth rate. To begin with, we have to get estimates of the next ten years of cash flows. Where possible we use analyst estimates, but when these aren't available we extrapolate the previous free cash flow (FCF) from the last estimate or reported value. We assume companies with shrinking free cash flow will slow their rate of shrinkage, and that companies with growing free cash flow will see their growth rate slow, over this period. We do this to reflect that growth tends to slow more in the early years than it does in later years.
Generally we assume that a dollar today is more valuable than a dollar in the future, so we need to discount the sum of these future cash flows to arrive at a present value estimate:
10-year free cash flow (FCF) estimate
| 2021 | 2022 | 2023 | 2024 | 2025 | 2026 | 2027 | 2028 | 2029 | 2030 | |
| Levered FCF (SAR, Millions) | ر.س125.6m | ر.س131.2m | ر.س150.4m | ر.س180.0m | ر.س200.4m | ر.س221.7m | ر.س244.1m | ر.س267.8m | ر.س293.1m | ر.س320.3m |
| Growth Rate Estimate Source | Analyst x3 | Analyst x3 | Analyst x3 | Analyst x2 | Est @ 11.35% | Est @ 10.61% | Est @ 10.09% | Est @ 9.72% | Est @ 9.47% | Est @ 9.29% |
| Present Value (SAR, Millions) Discounted @ 14% | ر.س110 | ر.س101 | ر.س102 | ر.س107 | ر.س104 | ر.س101 | ر.س97.9 | ر.س94.3 | ر.س90.6 | ر.س86.9 |
("Est" = FCF growth rate estimated by Simply Wall St)
Present Value of 10-year Cash Flow (PVCF) = ر.س995m
After calculating the present value of future cash flows in the initial 10-year period, we need to calculate the Terminal Value, which accounts for all future cash flows beyond the first stage. For a number of reasons a very conservative growth rate is used that cannot exceed that of a country's GDP growth. In this case we have used the 5-year average of the 10-year government bond yield (8.9%) to estimate future growth. In the same way as with the 10-year 'growth' period, we discount future cash flows to today's value, using a cost of equity of 14%.
Terminal Value (TV)= FCF2030 × (1 + g) ÷ (r – g) = ر.س320m× (1 + 8.9%) ÷ (14%– 8.9%) = ر.س6.9b
Present Value of Terminal Value (PVTV)= TV / (1 + r)10= ر.س6.9b÷ ( 1 + 14%)10= ر.س1.9b
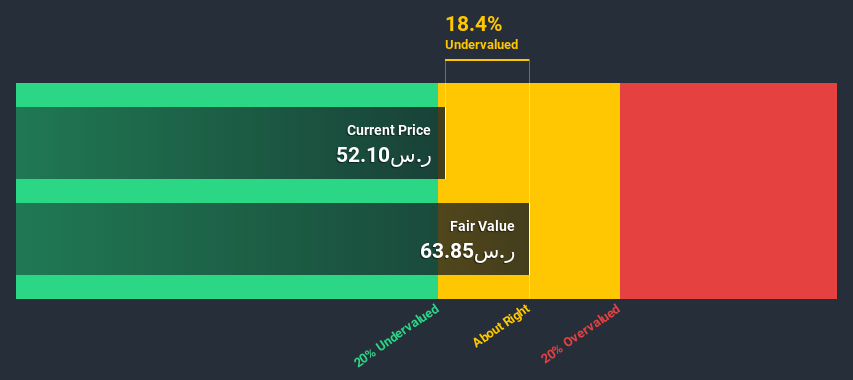
The total value, or equity value, is then the sum of the present value of the future cash flows, which in this case is ر.س2.9b. To get the intrinsic value per share, we divide this by the total number of shares outstanding. Compared to the current share price of ر.س52.1, the company appears about fair value at a 18% discount to where the stock price trades currently. Remember though, that this is just an approximate valuation, and like any complex formula - garbage in, garbage out.
The assumptions
Now the most important inputs to a discounted cash flow are the discount rate, and of course, the actual cash flows. If you don't agree with these result, have a go at the calculation yourself and play with the assumptions. The DCF also does not consider the possible cyclicality of an industry, or a company's future capital requirements, so it does not give a full picture of a company's potential performance. Given that we are looking at National Medical Care as potential shareholders, the cost of equity is used as the discount rate, rather than the cost of capital (or weighted average cost of capital, WACC) which accounts for debt. In this calculation we've used 14%, which is based on a levered beta of 0.809. Beta is a measure of a stock's volatility, compared to the market as a whole. We get our beta from the industry average beta of globally comparable companies, with an imposed limit between 0.8 and 2.0, which is a reasonable range for a stable business.
Moving On:
Valuation is only one side of the coin in terms of building your investment thesis, and it shouldn't be the only metric you look at when researching a company. The DCF model is not a perfect stock valuation tool. Preferably you'd apply different cases and assumptions and see how they would impact the company's valuation. For example, changes in the company's cost of equity or the risk free rate can significantly impact the valuation. For National Medical Care, there are three important elements you should consider:
- Risks: Consider for instance, the ever-present spectre of investment risk. We've identified 1 warning sign with National Medical Care , and understanding this should be part of your investment process.
- Future Earnings: How does 4005's growth rate compare to its peers and the wider market? Dig deeper into the analyst consensus number for the upcoming years by interacting with our free analyst growth expectation chart.
- Other Solid Businesses: Low debt, high returns on equity and good past performance are fundamental to a strong business. Why not explore our interactive list of stocks with solid business fundamentals to see if there are other companies you may not have considered!
PS. Simply Wall St updates its DCF calculation for every Saudi stock every day, so if you want to find the intrinsic value of any other stock just search here.
If you decide to trade National Medical Care, use the lowest-cost* platform that is rated #1 Overall by Barron’s, Interactive Brokers. Trade stocks, options, futures, forex, bonds and funds on 135 markets, all from a single integrated account. Promoted
If you're looking to trade National Medical Care, open an account with the lowest-cost platform trusted by professionals, Interactive Brokers.
With clients in over 200 countries and territories, and access to 160 markets, IBKR lets you trade stocks, options, futures, forex, bonds and funds from a single integrated account.
Enjoy no hidden fees, no account minimums, and FX conversion rates as low as 0.03%, far better than what most brokers offer.
Sponsored ContentValuation is complex, but we're here to simplify it.
Discover if National Medical Care might be undervalued or overvalued with our detailed analysis, featuring fair value estimates, potential risks, dividends, insider trades, and its financial condition.
Access Free AnalysisThis article by Simply Wall St is general in nature. It does not constitute a recommendation to buy or sell any stock, and does not take account of your objectives, or your financial situation. We aim to bring you long-term focused analysis driven by fundamental data. Note that our analysis may not factor in the latest price-sensitive company announcements or qualitative material. Simply Wall St has no position in any stocks mentioned.
*Interactive Brokers Rated Lowest Cost Broker by StockBrokers.com Annual Online Review 2020
Have feedback on this article? Concerned about the content? Get in touch with us directly. Alternatively, email editorial-team (at) simplywallst.com.
About SASE:4005
National Medical Care
National Medical Care Company establishes, own, equips, manages, maintains, and operates healthcare facilities in the Kingdom of Saudi Arabia.
Excellent balance sheet and good value.

