- Saudi Arabia
- /
- Food
- /
- SASE:6010
The Market Lifts The National Agricultural Development Company (TADAWUL:6010) Shares 29% But It Can Do More

Those holding The National Agricultural Development Company (TADAWUL:6010) shares would be relieved that the share price has rebounded 29% in the last thirty days, but it needs to keep going to repair the recent damage it has caused to investor portfolios. Looking back a bit further, it's encouraging to see the stock is up 37% in the last year.
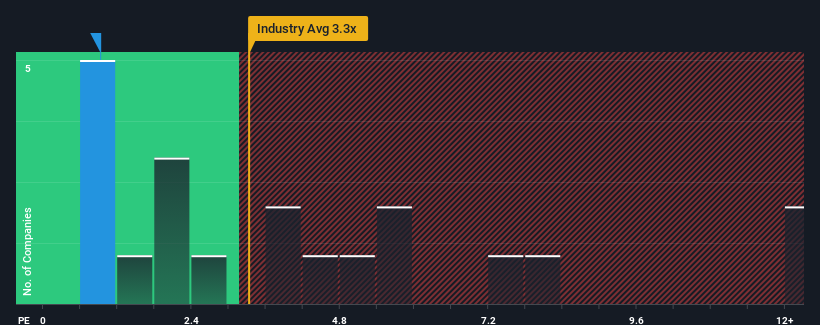
Although its price has surged higher, National Agricultural Development's price-to-sales (or "P/S") ratio of 0.9x might still make it look like a strong buy right now compared to the wider Food industry in Saudi Arabia, where around half of the companies have P/S ratios above 3.3x and even P/S above 6x are quite common. Although, it's not wise to just take the P/S at face value as there may be an explanation why it's so limited.
View our latest analysis for National Agricultural Development

What Does National Agricultural Development's Recent Performance Look Like?
National Agricultural Development certainly has been doing a good job lately as it's been growing revenue more than most other companies. It might be that many expect the strong revenue performance to degrade substantially, which has repressed the share price, and thus the P/S ratio. If you like the company, you'd be hoping this isn't the case so that you could potentially pick up some stock while it's out of favour.
Want the full picture on analyst estimates for the company? Then our free report on National Agricultural Development will help you uncover what's on the horizon.What Are Revenue Growth Metrics Telling Us About The Low P/S?
There's an inherent assumption that a company should far underperform the industry for P/S ratios like National Agricultural Development's to be considered reasonable.
Retrospectively, the last year delivered an exceptional 18% gain to the company's top line. Pleasingly, revenue has also lifted 35% in aggregate from three years ago, thanks to the last 12 months of growth. So we can start by confirming that the company has done a great job of growing revenue over that time.
Turning to the outlook, the next three years should generate growth of 8.3% each year as estimated by the dual analysts watching the company. That's shaping up to be similar to the 7.0% each year growth forecast for the broader industry.
With this information, we find it odd that National Agricultural Development is trading at a P/S lower than the industry. Apparently some shareholders are doubtful of the forecasts and have been accepting lower selling prices.
The Final Word
Shares in National Agricultural Development have risen appreciably however, its P/S is still subdued. Typically, we'd caution against reading too much into price-to-sales ratios when settling on investment decisions, though it can reveal plenty about what other market participants think about the company.
We've seen that National Agricultural Development currently trades on a lower than expected P/S since its forecast growth is in line with the wider industry. Despite average revenue growth estimates, there could be some unobserved threats keeping the P/S low. However, if you agree with the analysts' forecasts, you may be able to pick up the stock at an attractive price.
You need to take note of risks, for example - National Agricultural Development has 3 warning signs (and 1 which doesn't sit too well with us) we think you should know about.
Of course, profitable companies with a history of great earnings growth are generally safer bets. So you may wish to see this free collection of other companies that have reasonable P/E ratios and have grown earnings strongly.
If you're looking to trade National Agricultural Development, open an account with the lowest-cost platform trusted by professionals, Interactive Brokers.
With clients in over 200 countries and territories, and access to 160 markets, IBKR lets you trade stocks, options, futures, forex, bonds and funds from a single integrated account.
Enjoy no hidden fees, no account minimums, and FX conversion rates as low as 0.03%, far better than what most brokers offer.
Sponsored ContentValuation is complex, but we're here to simplify it.
Discover if National Agricultural Development might be undervalued or overvalued with our detailed analysis, featuring fair value estimates, potential risks, dividends, insider trades, and its financial condition.
Access Free AnalysisHave feedback on this article? Concerned about the content? Get in touch with us directly. Alternatively, email editorial-team (at) simplywallst.com.
This article by Simply Wall St is general in nature. We provide commentary based on historical data and analyst forecasts only using an unbiased methodology and our articles are not intended to be financial advice. It does not constitute a recommendation to buy or sell any stock, and does not take account of your objectives, or your financial situation. We aim to bring you long-term focused analysis driven by fundamental data. Note that our analysis may not factor in the latest price-sensitive company announcements or qualitative material. Simply Wall St has no position in any stocks mentioned.
About SASE:6010
National Agricultural Development
Engages in production of agricultural and livestock products in the Kingdom of Saudi Arabia and internationally.
Flawless balance sheet and good value.
Similar Companies
Market Insights
Community Narratives


