- Saudi Arabia
- /
- Food
- /
- SASE:2050
Savola Group Company (TADAWUL:2050) Stock's Been Sliding But Fundamentals Look Decent: Will The Market Correct The Share Price In The Future?


Savola Group (TADAWUL:2050) has had a rough month with its share price down 34%. However, stock prices are usually driven by a company’s financials over the long term, which in this case look pretty respectable. In this article, we decided to focus on Savola Group's ROE.
Return on Equity or ROE is a test of how effectively a company is growing its value and managing investors’ money. Simply put, it is used to assess the profitability of a company in relation to its equity capital.
View our latest analysis for Savola Group
How To Calculate Return On Equity?
ROE can be calculated by using the formula:
Return on Equity = Net Profit (from continuing operations) ÷ Shareholders' Equity
So, based on the above formula, the ROE for Savola Group is:
11% = ر.س1.0b ÷ ر.س9.7b (Based on the trailing twelve months to June 2024).
The 'return' is the yearly profit. That means that for every SAR1 worth of shareholders' equity, the company generated SAR0.11 in profit.
Why Is ROE Important For Earnings Growth?
So far, we've learned that ROE is a measure of a company's profitability. Depending on how much of these profits the company reinvests or "retains", and how effectively it does so, we are then able to assess a company’s earnings growth potential. Generally speaking, other things being equal, firms with a high return on equity and profit retention, have a higher growth rate than firms that don’t share these attributes.
A Side By Side comparison of Savola Group's Earnings Growth And 11% ROE
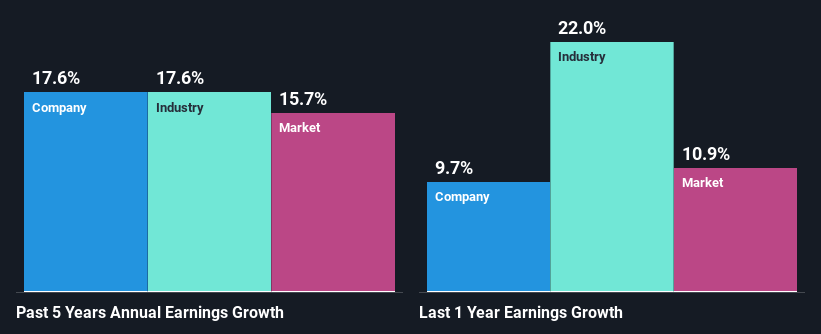
It is quite clear that Savola Group's ROE is rather low. Even compared to the average industry ROE of 15%, the company's ROE is quite dismal. Savola Group was still able to see a decent net income growth of 18% over the past five years. We reckon that there could be other factors at play here. Such as - high earnings retention or an efficient management in place.
Next, on comparing Savola Group's net income growth with the industry, we found that the company's reported growth is similar to the industry average growth rate of 18% over the last few years.
Earnings growth is a huge factor in stock valuation. The investor should try to establish if the expected growth or decline in earnings, whichever the case may be, is priced in. This then helps them determine if the stock is placed for a bright or bleak future. Is 2050 fairly valued? This infographic on the company's intrinsic value has everything you need to know.
Is Savola Group Using Its Retained Earnings Effectively?
Savola Group has a three-year median payout ratio of 45%, which implies that it retains the remaining 55% of its profits. This suggests that its dividend is well covered, and given the decent growth seen by the company, it looks like management is reinvesting its earnings efficiently.
Moreover, Savola Group is determined to keep sharing its profits with shareholders which we infer from its long history of paying a dividend for at least ten years. Our latest analyst data shows that the future payout ratio of the company over the next three years is expected to be approximately 48%. As a result, Savola Group's ROE is not expected to change by much either, which we inferred from the analyst estimate of 11% for future ROE.
Summary
On the whole, we do feel that Savola Group has some positive attributes. With a high rate of reinvestment, albeit at a low ROE, the company has managed to see a considerable growth in its earnings. With that said, the latest industry analyst forecasts reveal that the company's earnings are expected to accelerate. To know more about the company's future earnings growth forecasts take a look at this free report on analyst forecasts for the company to find out more.
New: Manage All Your Stock Portfolios in One Place
We've created the ultimate portfolio companion for stock investors, and it's free.
• Connect an unlimited number of Portfolios and see your total in one currency
• Be alerted to new Warning Signs or Risks via email or mobile
• Track the Fair Value of your stocks
Have feedback on this article? Concerned about the content? Get in touch with us directly. Alternatively, email editorial-team (at) simplywallst.com.
This article by Simply Wall St is general in nature. We provide commentary based on historical data and analyst forecasts only using an unbiased methodology and our articles are not intended to be financial advice. It does not constitute a recommendation to buy or sell any stock, and does not take account of your objectives, or your financial situation. We aim to bring you long-term focused analysis driven by fundamental data. Note that our analysis may not factor in the latest price-sensitive company announcements or qualitative material. Simply Wall St has no position in any stocks mentioned.
About SASE:2050
Excellent balance sheet with proven track record and pays a dividend.

