
Advertisement
- Saudi Arabia
- /
- Oil and Gas
- /
- SASE:2222
Saudi Arabian Oil (TADAWUL:2222) Shareholders Have Enjoyed A 17% Share Price Gain
There's no doubt that investing in the stock market is a truly brilliant way to build wealth. But if you choose that path, you're going to buy some stocks that fall short of the market. Unfortunately for shareholders, while the Saudi Arabian Oil Company (TADAWUL:2222) share price is up 17% in the last year, that falls short of the market return. Saudi Arabian Oil hasn't been listed for long, so it's still not clear if it is a long term winner.
See our latest analysis for Saudi Arabian Oil
To quote Buffett, 'Ships will sail around the world but the Flat Earth Society will flourish. There will continue to be wide discrepancies between price and value in the marketplace...' One flawed but reasonable way to assess how sentiment around a company has changed is to compare the earnings per share (EPS) with the share price.
Over the last twelve months, Saudi Arabian Oil actually shrank its EPS by 42%.
So we don't think that investors are paying too much attention to EPS. Indeed, when EPS is declining but the share price is up, it often means the market is considering other factors.
Unfortunately Saudi Arabian Oil's fell 27% over twelve months. So using a snapshot of key business metrics doesn't give us a good picture of why the market is bidding up the stock.
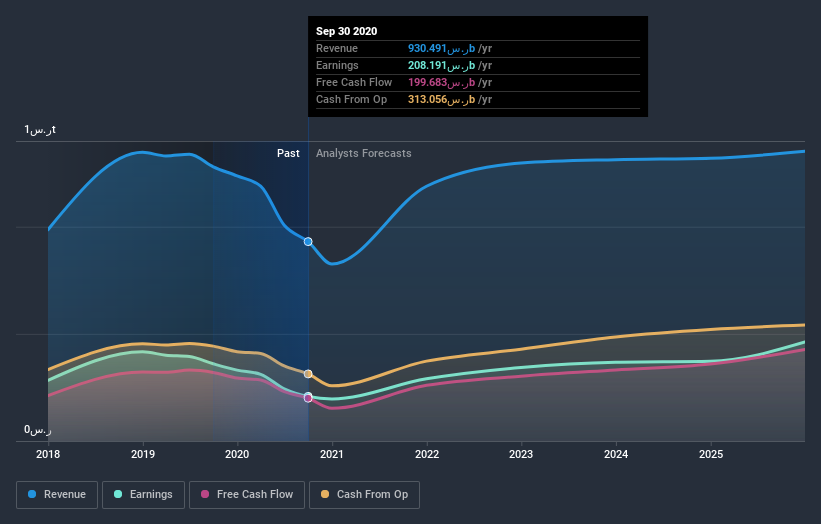
You can see below how earnings and revenue have changed over time (discover the exact values by clicking on the image).
Saudi Arabian Oil is a well known stock, with plenty of analyst coverage, suggesting some visibility into future growth. If you are thinking of buying or selling Saudi Arabian Oil stock, you should check out this free report showing analyst consensus estimates for future profits.
What About Dividends?
As well as measuring the share price return, investors should also consider the total shareholder return (TSR). The TSR is a return calculation that accounts for the value of cash dividends (assuming that any dividend received was reinvested) and the calculated value of any discounted capital raisings and spin-offs. Arguably, the TSR gives a more comprehensive picture of the return generated by a stock. As it happens, Saudi Arabian Oil's TSR for the last year was 21%, which exceeds the share price return mentioned earlier. The dividends paid by the company have thusly boosted the total shareholder return.
A Different Perspective
We're happy to report that Saudi Arabian Oil are up 21% over the year (even including dividends). The bad news is that's no better than the average market return, which was roughly 26%. Unfortunately the share price is down 1.3% over the last quarter. It's possible that this is just a short term share price setback. If the business executes and delivers key metric growth, it could definitely be worth putting on your watchlist. While it is well worth considering the different impacts that market conditions can have on the share price, there are other factors that are even more important. To that end, you should be aware of the 2 warning signs we've spotted with Saudi Arabian Oil .
If you are like me, then you will not want to miss this free list of growing companies that insiders are buying.
Please note, the market returns quoted in this article reflect the market weighted average returns of stocks that currently trade on SA exchanges.
If you decide to trade Saudi Arabian Oil, use the lowest-cost* platform that is rated #1 Overall by Barron’s, Interactive Brokers. Trade stocks, options, futures, forex, bonds and funds on 135 markets, all from a single integrated account. Promoted
New: Manage All Your Stock Portfolios in One Place
We've created the ultimate portfolio companion for stock investors, and it's free.
• Connect an unlimited number of Portfolios and see your total in one currency
• Be alerted to new Warning Signs or Risks via email or mobile
• Track the Fair Value of your stocks
This article by Simply Wall St is general in nature. It does not constitute a recommendation to buy or sell any stock, and does not take account of your objectives, or your financial situation. We aim to bring you long-term focused analysis driven by fundamental data. Note that our analysis may not factor in the latest price-sensitive company announcements or qualitative material. Simply Wall St has no position in any stocks mentioned.
*Interactive Brokers Rated Lowest Cost Broker by StockBrokers.com Annual Online Review 2020
Have feedback on this article? Concerned about the content? Get in touch with us directly. Alternatively, email editorial-team (at) simplywallst.com.
About SASE:2222
Saudi Arabian Oil
Operates as an integrated energy and chemical company in the Kingdom of Saudi Arabia and internationally.
Excellent balance sheet with acceptable track record.
Similar Companies
Market Insights

Advertisement
Community Narratives
Scaling up in building materials with smart M&A and growing profitability
Fair Value US$2.77|29.6% undervalued
CM
Community Contributor
Hims: The Platform Powering Personalised Healthcare
Fair Value US$114.01|49.1% undervalued
BL
Community Contributor
Undervalued lottery company with strong fundamentals
Fair Value AU$15.00|35.8% undervalued
RO
Community Contributor
Proximus, transferring money from the impatient to the patient investor
Fair Value €16.62|55.2% undervalued
AX
Community Contributor