
Advertisement
- Saudi Arabia
- /
- Professional Services
- /
- SASE:9570
Tam Development (TADAWUL:9570) Could Become A Multi-Bagger
What are the early trends we should look for to identify a stock that could multiply in value over the long term? Amongst other things, we'll want to see two things; firstly, a growing return on capital employed (ROCE) and secondly, an expansion in the company's amount of capital employed. Put simply, these types of businesses are compounding machines, meaning they are continually reinvesting their earnings at ever-higher rates of return. And in light of that, the trends we're seeing at Tam Development's (TADAWUL:9570) look very promising so lets take a look.
Understanding Return On Capital Employed (ROCE)
If you haven't worked with ROCE before, it measures the 'return' (pre-tax profit) a company generates from capital employed in its business. The formula for this calculation on Tam Development is:
Return on Capital Employed = Earnings Before Interest and Tax (EBIT) ÷ (Total Assets - Current Liabilities)
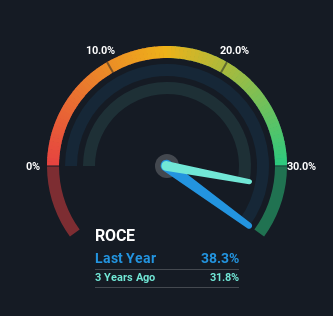
0.38 = ر.س44m ÷ (ر.س189m - ر.س74m) (Based on the trailing twelve months to December 2023).
So, Tam Development has an ROCE of 38%. That's a fantastic return and not only that, it outpaces the average of 21% earned by companies in a similar industry.
Check out our latest analysis for Tam Development
Above you can see how the current ROCE for Tam Development compares to its prior returns on capital, but there's only so much you can tell from the past. If you're interested, you can view the analysts predictions in our free analyst report for Tam Development .
So How Is Tam Development's ROCE Trending?
Investors would be pleased with what's happening at Tam Development. Over the last three years, returns on capital employed have risen substantially to 38%. The amount of capital employed has increased too, by 256%. So we're very much inspired by what we're seeing at Tam Development thanks to its ability to profitably reinvest capital.
For the record though, there was a noticeable increase in the company's current liabilities over the period, so we would attribute some of the ROCE growth to that. Essentially the business now has suppliers or short-term creditors funding about 39% of its operations, which isn't ideal. Keep an eye out for future increases because when the ratio of current liabilities to total assets gets particularly high, this can introduce some new risks for the business.
Our Take On Tam Development's ROCE
A company that is growing its returns on capital and can consistently reinvest in itself is a highly sought after trait, and that's what Tam Development has. And investors seem to expect more of this going forward, since the stock has rewarded shareholders with a 46% return over the last year. Therefore, we think it would be worth your time to check if these trends are going to continue.
Since virtually every company faces some risks, it's worth knowing what they are, and we've spotted 2 warning signs for Tam Development (of which 1 doesn't sit too well with us!) that you should know about.
High returns are a key ingredient to strong performance, so check out our free list ofstocks earning high returns on equity with solid balance sheets.
Valuation is complex, but we're here to simplify it.
Discover if Tam Development might be undervalued or overvalued with our detailed analysis, featuring fair value estimates, potential risks, dividends, insider trades, and its financial condition.
Access Free AnalysisHave feedback on this article? Concerned about the content? Get in touch with us directly. Alternatively, email editorial-team (at) simplywallst.com.
This article by Simply Wall St is general in nature. We provide commentary based on historical data and analyst forecasts only using an unbiased methodology and our articles are not intended to be financial advice. It does not constitute a recommendation to buy or sell any stock, and does not take account of your objectives, or your financial situation. We aim to bring you long-term focused analysis driven by fundamental data. Note that our analysis may not factor in the latest price-sensitive company announcements or qualitative material. Simply Wall St has no position in any stocks mentioned.
About SASE:9570
Tam Development
Operates as a management and digital solutions consultancy in Saudi Arabia.
Adequate balance sheet with slight risk.
Market Insights

Advertisement
Community Narratives
A formidable player in AI and enterprise computing.
Fair Value US$210.00|2.3% overvalued
CO
Community Contributor
IREN's Bold Moves in Sustainable Bitcoin Mining & AI Data Centers
Fair Value US$72.52|17.6% undervalued
BL
Community Contributor
Cooling the Champions: The Aussie Tech Behind F1's Victories
Fair Value AU$12.40|40.4% undervalued
TR
Community Contributor