
Advertisement
- Saudi Arabia
- /
- Trade Distributors
- /
- SASE:9510
Revenues Tell The Story For National Building and Marketing Co. (TADAWUL:9510) As Its Stock Soars 27%

National Building and Marketing Co. (TADAWUL:9510) shares have had a really impressive month, gaining 27% after a shaky period beforehand. Looking further back, the 13% rise over the last twelve months isn't too bad notwithstanding the strength over the last 30 days.
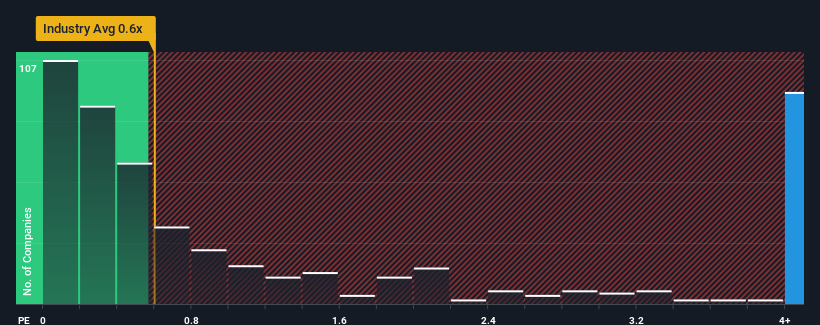
Since its price has surged higher, you could be forgiven for thinking National Building and Marketing is a stock to steer clear of with a price-to-sales ratios (or "P/S") of 5.5x, considering almost half the companies in Saudi Arabia's Trade Distributors industry have P/S ratios below 2x. However, the P/S might be quite high for a reason and it requires further investigation to determine if it's justified.
Check out our latest analysis for National Building and Marketing
What Does National Building and Marketing's P/S Mean For Shareholders?
As an illustration, revenue has deteriorated at National Building and Marketing over the last year, which is not ideal at all. Perhaps the market believes the company can do enough to outperform the rest of the industry in the near future, which is keeping the P/S ratio high. However, if this isn't the case, investors might get caught out paying too much for the stock.
Want the full picture on earnings, revenue and cash flow for the company? Then our free report on National Building and Marketing will help you shine a light on its historical performance.Do Revenue Forecasts Match The High P/S Ratio?
There's an inherent assumption that a company should far outperform the industry for P/S ratios like National Building and Marketing's to be considered reasonable.
In reviewing the last year of financials, we were disheartened to see the company's revenues fell to the tune of 7.6%. The latest three year period has seen an incredible overall rise in revenue, a stark contrast to the last 12 months. So while the company has done a great job in the past, it's somewhat concerning to see revenue growth decline so harshly.
When compared to the industry's one-year growth forecast of 3.5%, the most recent medium-term revenue trajectory is noticeably more alluring
With this information, we can see why National Building and Marketing is trading at such a high P/S compared to the industry. It seems most investors are expecting this strong growth to continue and are willing to pay more for the stock.
The Bottom Line On National Building and Marketing's P/S
The strong share price surge has lead to National Building and Marketing's P/S soaring as well. We'd say the price-to-sales ratio's power isn't primarily as a valuation instrument but rather to gauge current investor sentiment and future expectations.
It's no surprise that National Building and Marketing can support its high P/S given the strong revenue growth its experienced over the last three-year is superior to the current industry outlook. Right now shareholders are comfortable with the P/S as they are quite confident revenue aren't under threat. Unless the recent medium-term conditions change, they will continue to provide strong support to the share price.
Having said that, be aware National Building and Marketing is showing 4 warning signs in our investment analysis, and 2 of those are a bit unpleasant.
If strong companies turning a profit tickle your fancy, then you'll want to check out this free list of interesting companies that trade on a low P/E (but have proven they can grow earnings).
Valuation is complex, but we're here to simplify it.
Discover if National Building and Marketing might be undervalued or overvalued with our detailed analysis, featuring fair value estimates, potential risks, dividends, insider trades, and its financial condition.
Access Free AnalysisHave feedback on this article? Concerned about the content? Get in touch with us directly. Alternatively, email editorial-team (at) simplywallst.com.
This article by Simply Wall St is general in nature. We provide commentary based on historical data and analyst forecasts only using an unbiased methodology and our articles are not intended to be financial advice. It does not constitute a recommendation to buy or sell any stock, and does not take account of your objectives, or your financial situation. We aim to bring you long-term focused analysis driven by fundamental data. Note that our analysis may not factor in the latest price-sensitive company announcements or qualitative material. Simply Wall St has no position in any stocks mentioned.
About SASE:9510
National Building and Marketing
Engages in the wholesale and retail of construction materials in the Kingdom of Saudi Arabia.
Slight with mediocre balance sheet.
Market Insights

Advertisement
Community Narratives
Scaling up in building materials with smart M&A and growing profitability
Fair Value US$2.77|28.9% undervalued
CM
Community Contributor
Hims: The Platform Powering Personalised Healthcare
Fair Value US$114.01|46.3% undervalued
BL
Community Contributor
Undervalued lottery company with strong fundamentals
Fair Value AU$15.00|35.8% undervalued
RO
Community Contributor
Proximus, transferring money from the impatient to the patient investor
Fair Value €16.62|56.1% undervalued
AX
Community Contributor