
Advertisement
- Romania
- /
- Real Estate
- /
- BVB:MALI
Weak Financial Prospects Seem To Be Dragging Down S.C. Comalim S.A. (BVB:MALI) Stock

With its stock down 21% over the past month, it is easy to disregard S.C. Comalim (BVB:MALI). To decide if this trend could continue, we decided to look at its weak fundamentals as they shape the long-term market trends. In this article, we decided to focus on S.C. Comalim's ROE.
Return on Equity or ROE is a test of how effectively a company is growing its value and managing investors’ money. In other words, it is a profitability ratio which measures the rate of return on the capital provided by the company's shareholders.
See our latest analysis for S.C. Comalim
How To Calculate Return On Equity?
ROE can be calculated by using the formula:
Return on Equity = Net Profit (from continuing operations) ÷ Shareholders' Equity
So, based on the above formula, the ROE for S.C. Comalim is:
1.6% = RON326k ÷ RON20m (Based on the trailing twelve months to June 2024).
The 'return' refers to a company's earnings over the last year. So, this means that for every RON1 of its shareholder's investments, the company generates a profit of RON0.02.
What Is The Relationship Between ROE And Earnings Growth?
Thus far, we have learned that ROE measures how efficiently a company is generating its profits. Based on how much of its profits the company chooses to reinvest or "retain", we are then able to evaluate a company's future ability to generate profits. Generally speaking, other things being equal, firms with a high return on equity and profit retention, have a higher growth rate than firms that don’t share these attributes.
S.C. Comalim's Earnings Growth And 1.6% ROE
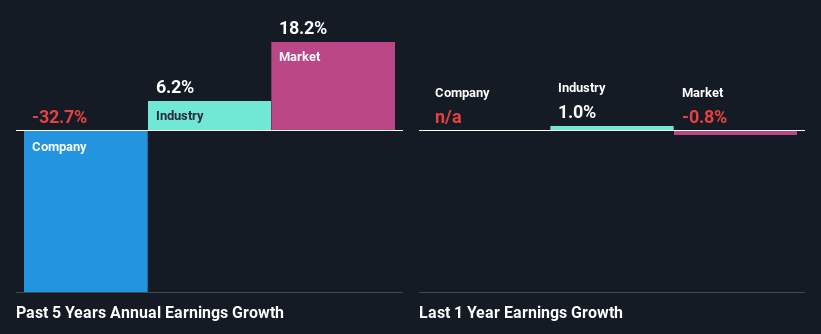
It is quite clear that S.C. Comalim's ROE is rather low. Not just that, even compared to the industry average of 3.6%, the company's ROE is entirely unremarkable. Therefore, it might not be wrong to say that the five year net income decline of 33% seen by S.C. Comalim was possibly a result of it having a lower ROE. We believe that there also might be other aspects that are negatively influencing the company's earnings prospects. Such as - low earnings retention or poor allocation of capital.
That being said, we compared S.C. Comalim's performance with the industry and were concerned when we found that while the company has shrunk its earnings, the industry has grown its earnings at a rate of 6.2% in the same 5-year period.
Earnings growth is a huge factor in stock valuation. What investors need to determine next is if the expected earnings growth, or the lack of it, is already built into the share price. Doing so will help them establish if the stock's future looks promising or ominous. One good indicator of expected earnings growth is the P/E ratio which determines the price the market is willing to pay for a stock based on its earnings prospects. So, you may want to check if S.C. Comalim is trading on a high P/E or a low P/E, relative to its industry.
Is S.C. Comalim Using Its Retained Earnings Effectively?
With a high three-year median payout ratio of 100% (implying that 0.4% of the profits are retained), most of S.C. Comalim's profits are being paid to shareholders, which explains the company's shrinking earnings. The business is only left with a small pool of capital to reinvest - A vicious cycle that doesn't benefit the company in the long-run. Our risks dashboard should have the 4 risks we have identified for S.C. Comalim.
In addition, S.C. Comalim has been paying dividends over a period of three years suggesting that keeping up dividend payments is preferred by the management even though earnings have been in decline.
Conclusion
In total, we would have a hard think before deciding on any investment action concerning S.C. Comalim. Specifically, it has shown quite an unsatisfactory performance as far as earnings growth is concerned, and a poor ROE and an equally poor rate of reinvestment seem to be the reason behind this inadequate performance. So far, we've only made a quick discussion around the company's earnings growth. To gain further insights into S.C. Comalim's past profit growth, check out this visualization of past earnings, revenue and cash flows.
New: Manage All Your Stock Portfolios in One Place
We've created the ultimate portfolio companion for stock investors, and it's free.
• Connect an unlimited number of Portfolios and see your total in one currency
• Be alerted to new Warning Signs or Risks via email or mobile
• Track the Fair Value of your stocks
Have feedback on this article? Concerned about the content? Get in touch with us directly. Alternatively, email editorial-team (at) simplywallst.com.
This article by Simply Wall St is general in nature. We provide commentary based on historical data and analyst forecasts only using an unbiased methodology and our articles are not intended to be financial advice. It does not constitute a recommendation to buy or sell any stock, and does not take account of your objectives, or your financial situation. We aim to bring you long-term focused analysis driven by fundamental data. Note that our analysis may not factor in the latest price-sensitive company announcements or qualitative material. Simply Wall St has no position in any stocks mentioned.
About BVB:MALI
Flawless balance sheet slight.
Market Insights

Advertisement
Community Narratives
PPG Industries set to soar with 9% revenue growth in the next 3 years
Fair Value US$152.76|24.9% undervalued
DM
Community Contributor
Predicting a Steady Future for Crocs with Modest Growth and a 10% Discount Rate
Fair Value US$151.43|33.2% undervalued
JO
Community Contributor