Declining Stock and Decent Financials: Is The Market Wrong About S.C. Bucovina S.A. (BVB:BUCS)?


S.C. Bucovina (BVB:BUCS) has had a rough three months with its share price down 28%. But if you pay close attention, you might find that its key financial indicators look quite decent, which could mean that the stock could potentially rise in the long-term given how markets usually reward more resilient long-term fundamentals. Particularly, we will be paying attention to S.C. Bucovina's ROE today.
Return on Equity or ROE is a test of how effectively a company is growing its value and managing investors’ money. Simply put, it is used to assess the profitability of a company in relation to its equity capital.
Our free stock report includes 3 warning signs investors should be aware of before investing in S.C. Bucovina. Read for free now.How Is ROE Calculated?
ROE can be calculated by using the formula:
Return on Equity = Net Profit (from continuing operations) ÷ Shareholders' Equity
So, based on the above formula, the ROE for S.C. Bucovina is:
2.3% = RON155k ÷ RON6.9m (Based on the trailing twelve months to December 2024).
The 'return' refers to a company's earnings over the last year. So, this means that for every RON1 of its shareholder's investments, the company generates a profit of RON0.02.
View our latest analysis for S.C. Bucovina
What Has ROE Got To Do With Earnings Growth?
So far, we've learned that ROE is a measure of a company's profitability. Based on how much of its profits the company chooses to reinvest or "retain", we are then able to evaluate a company's future ability to generate profits. Generally speaking, other things being equal, firms with a high return on equity and profit retention, have a higher growth rate than firms that don’t share these attributes.
S.C. Bucovina's Earnings Growth And 2.3% ROE
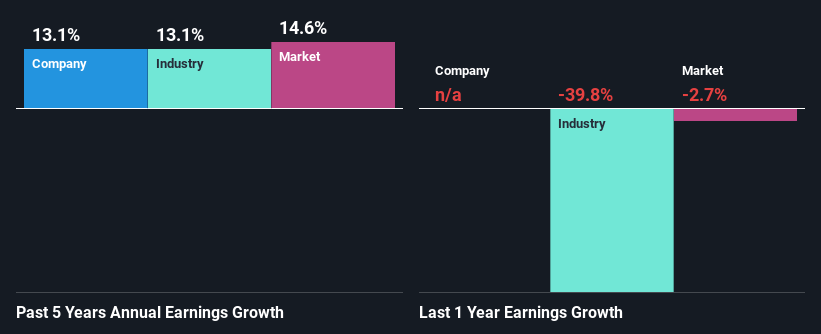
As you can see, S.C. Bucovina's ROE looks pretty weak. Not just that, even compared to the industry average of 3.2%, the company's ROE is entirely unremarkable. Although, we can see that S.C. Bucovina saw a modest net income growth of 13% over the past five years. We reckon that there could be other factors at play here. For instance, the company has a low payout ratio or is being managed efficiently.
Next, on comparing S.C. Bucovina's net income growth with the industry, we found that the company's reported growth is similar to the industry average growth rate of 13% over the last few years.
The basis for attaching value to a company is, to a great extent, tied to its earnings growth. The investor should try to establish if the expected growth or decline in earnings, whichever the case may be, is priced in. This then helps them determine if the stock is placed for a bright or bleak future. One good indicator of expected earnings growth is the P/E ratio which determines the price the market is willing to pay for a stock based on its earnings prospects. So, you may want to check if S.C. Bucovina is trading on a high P/E or a low P/E, relative to its industry.
Is S.C. Bucovina Making Efficient Use Of Its Profits?
S.C. Bucovina doesn't pay any regular dividends, meaning that all of its profits are being reinvested in the business, which explains the fair bit of earnings growth the company has seen.
Conclusion
Overall, we feel that S.C. Bucovina certainly does have some positive factors to consider. Despite its low rate of return, the fact that the company reinvests a very high portion of its profits into its business, no doubt contributed to its high earnings growth. While we won't completely dismiss the company, what we would do, is try to ascertain how risky the business is to make a more informed decision around the company. You can see the 3 risks we have identified for S.C. Bucovina by visiting our risks dashboard for free on our platform here.
New: Manage All Your Stock Portfolios in One Place
We've created the ultimate portfolio companion for stock investors, and it's free.
• Connect an unlimited number of Portfolios and see your total in one currency
• Be alerted to new Warning Signs or Risks via email or mobile
• Track the Fair Value of your stocks
Have feedback on this article? Concerned about the content? Get in touch with us directly. Alternatively, email editorial-team (at) simplywallst.com.
This article by Simply Wall St is general in nature. We provide commentary based on historical data and analyst forecasts only using an unbiased methodology and our articles are not intended to be financial advice. It does not constitute a recommendation to buy or sell any stock, and does not take account of your objectives, or your financial situation. We aim to bring you long-term focused analysis driven by fundamental data. Note that our analysis may not factor in the latest price-sensitive company announcements or qualitative material. Simply Wall St has no position in any stocks mentioned.
About BVB:BUCS
S.C. Bucovina
S.C. Bucovina S.A. collects, processes, stores, and retails milk, dairy products, and ice-creams in Romania.
Excellent balance sheet low.
Market Insights

Community Narratives


