- Romania
- /
- Oil and Gas
- /
- BVB:OIL
The three-year shareholder returns and company earnings persist lower as Oil Terminal (BVB:OIL) stock falls a further 12% in past week


As an investor its worth striving to ensure your overall portfolio beats the market average. But if you try your hand at stock picking, your risk returning less than the market. Unfortunately, that's been the case for longer term Oil Terminal S.A. (BVB:OIL) shareholders, since the share price is down 45% in the last three years, falling well short of the market return of around 82%. The falls have accelerated recently, with the share price down 20% in the last three months.
With the stock having lost 12% in the past week, it's worth taking a look at business performance and seeing if there's any red flags.
Check out our latest analysis for Oil Terminal
While the efficient markets hypothesis continues to be taught by some, it has been proven that markets are over-reactive dynamic systems, and investors are not always rational. By comparing earnings per share (EPS) and share price changes over time, we can get a feel for how investor attitudes to a company have morphed over time.
During the three years that the share price fell, Oil Terminal's earnings per share (EPS) dropped by 2.0% each year. This reduction in EPS is slower than the 18% annual reduction in the share price. So it's likely that the EPS decline has disappointed the market, leaving investors hesitant to buy.
The image below shows how EPS has tracked over time (if you click on the image you can see greater detail).
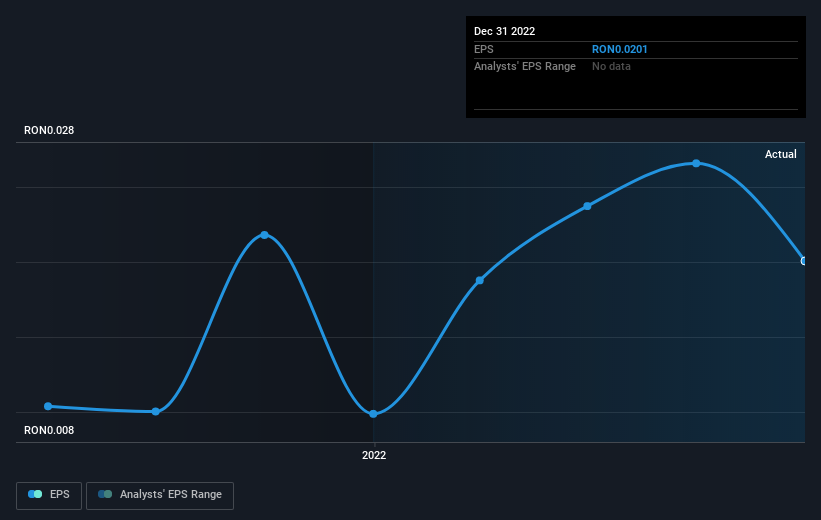
It might be well worthwhile taking a look at our free report on Oil Terminal's earnings, revenue and cash flow.
What About Dividends?
When looking at investment returns, it is important to consider the difference between total shareholder return (TSR) and share price return. Whereas the share price return only reflects the change in the share price, the TSR includes the value of dividends (assuming they were reinvested) and the benefit of any discounted capital raising or spin-off. It's fair to say that the TSR gives a more complete picture for stocks that pay a dividend. In the case of Oil Terminal, it has a TSR of -41% for the last 3 years. That exceeds its share price return that we previously mentioned. The dividends paid by the company have thusly boosted the total shareholder return.
A Different Perspective
While the broader market gained around 3.9% in the last year, Oil Terminal shareholders lost 18% (even including dividends). However, keep in mind that even the best stocks will sometimes underperform the market over a twelve month period. Regrettably, last year's performance caps off a bad run, with the shareholders facing a total loss of 3% per year over five years. We realise that Baron Rothschild has said investors should "buy when there is blood on the streets", but we caution that investors should first be sure they are buying a high quality business. While it is well worth considering the different impacts that market conditions can have on the share price, there are other factors that are even more important. Even so, be aware that Oil Terminal is showing 3 warning signs in our investment analysis , and 1 of those is a bit unpleasant...
If you like to buy stocks alongside management, then you might just love this free list of companies. (Hint: insiders have been buying them).
Please note, the market returns quoted in this article reflect the market weighted average returns of stocks that currently trade on Romanian exchanges.
New: AI Stock Screener & Alerts
Our new AI Stock Screener scans the market every day to uncover opportunities.
• Dividend Powerhouses (3%+ Yield)
• Undervalued Small Caps with Insider Buying
• High growth Tech and AI Companies
Or build your own from over 50 metrics.
Have feedback on this article? Concerned about the content? Get in touch with us directly. Alternatively, email editorial-team (at) simplywallst.com.
This article by Simply Wall St is general in nature. We provide commentary based on historical data and analyst forecasts only using an unbiased methodology and our articles are not intended to be financial advice. It does not constitute a recommendation to buy or sell any stock, and does not take account of your objectives, or your financial situation. We aim to bring you long-term focused analysis driven by fundamental data. Note that our analysis may not factor in the latest price-sensitive company announcements or qualitative material. Simply Wall St has no position in any stocks mentioned.
About BVB:OIL
Oil Terminal
Operates a terminal for import, export, and transit of crude oil, petroleum, petrochemical, liquid chemical products, and other services in south-eastern Europe.
Adequate balance sheet with questionable track record.
Similar Companies
Market Insights

Community Narratives

