Did You Participate In Any Of Masraf Al Rayan (Q.P.S.C.)'s (DSM:MARK) Respectable 64% Return?


Generally speaking the aim of active stock picking is to find companies that provide returns that are superior to the market average. And in our experience, buying the right stocks can give your wealth a significant boost. For example, long term Masraf Al Rayan (Q.P.S.C.) (DSM:MARK) shareholders have enjoyed a 27% share price rise over the last half decade, well in excess of the market return of around 11% (not including dividends). On the other hand, the more recent gains haven't been so impressive, with shareholders gaining just 19% , including dividends .
See our latest analysis for Masraf Al Rayan (Q.P.S.C.)
In his essay The Superinvestors of Graham-and-Doddsville Warren Buffett described how share prices do not always rationally reflect the value of a business. By comparing earnings per share (EPS) and share price changes over time, we can get a feel for how investor attitudes to a company have morphed over time.
During five years of share price growth, Masraf Al Rayan (Q.P.S.C.) achieved compound earnings per share (EPS) growth of 0.9% per year. This EPS growth is slower than the share price growth of 5% per year, over the same period. This suggests that market participants hold the company in higher regard, these days. That's not necessarily surprising considering the five-year track record of earnings growth.
The image below shows how EPS has tracked over time (if you click on the image you can see greater detail).
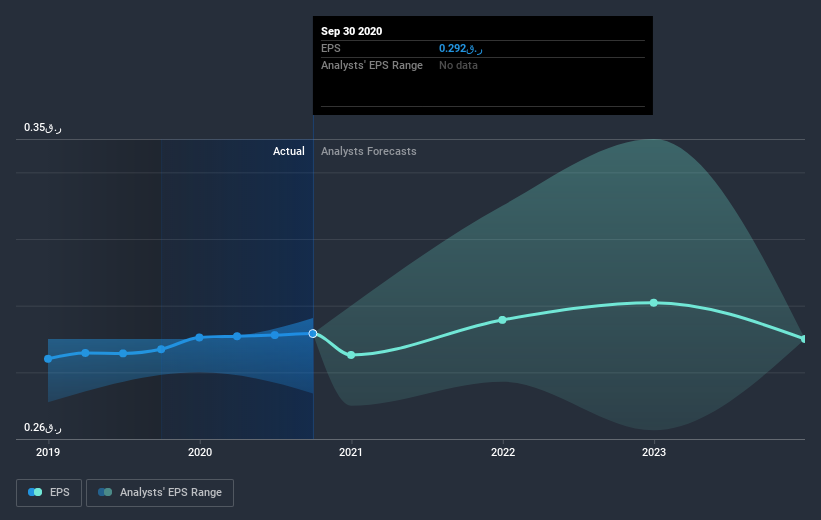
It might be well worthwhile taking a look at our free report on Masraf Al Rayan (Q.P.S.C.)'s earnings, revenue and cash flow.
What About Dividends?
As well as measuring the share price return, investors should also consider the total shareholder return (TSR). The TSR is a return calculation that accounts for the value of cash dividends (assuming that any dividend received was reinvested) and the calculated value of any discounted capital raisings and spin-offs. So for companies that pay a generous dividend, the TSR is often a lot higher than the share price return. We note that for Masraf Al Rayan (Q.P.S.C.) the TSR over the last 5 years was 64%, which is better than the share price return mentioned above. This is largely a result of its dividend payments!
A Different Perspective
It's good to see that Masraf Al Rayan (Q.P.S.C.) has rewarded shareholders with a total shareholder return of 19% in the last twelve months. Of course, that includes the dividend. That gain is better than the annual TSR over five years, which is 10%. Therefore it seems like sentiment around the company has been positive lately. Given the share price momentum remains strong, it might be worth taking a closer look at the stock, lest you miss an opportunity. It's always interesting to track share price performance over the longer term. But to understand Masraf Al Rayan (Q.P.S.C.) better, we need to consider many other factors. Take risks, for example - Masraf Al Rayan (Q.P.S.C.) has 1 warning sign we think you should be aware of.
Of course, you might find a fantastic investment by looking elsewhere. So take a peek at this free list of companies we expect will grow earnings.
Please note, the market returns quoted in this article reflect the market weighted average returns of stocks that currently trade on QA exchanges.
If you’re looking to trade Masraf Al Rayan (Q.P.S.C.), open an account with the lowest-cost* platform trusted by professionals, Interactive Brokers. Their clients from over 200 countries and territories trade stocks, options, futures, forex, bonds and funds worldwide from a single integrated account. Promoted
If you're looking to trade Masraf Al Rayan (Q.P.S.C.), open an account with the lowest-cost platform trusted by professionals, Interactive Brokers.
With clients in over 200 countries and territories, and access to 160 markets, IBKR lets you trade stocks, options, futures, forex, bonds and funds from a single integrated account.
Enjoy no hidden fees, no account minimums, and FX conversion rates as low as 0.03%, far better than what most brokers offer.
Sponsored ContentNew: Manage All Your Stock Portfolios in One Place
We've created the ultimate portfolio companion for stock investors, and it's free.
• Connect an unlimited number of Portfolios and see your total in one currency
• Be alerted to new Warning Signs or Risks via email or mobile
• Track the Fair Value of your stocks
This article by Simply Wall St is general in nature. It does not constitute a recommendation to buy or sell any stock, and does not take account of your objectives, or your financial situation. We aim to bring you long-term focused analysis driven by fundamental data. Note that our analysis may not factor in the latest price-sensitive company announcements or qualitative material. Simply Wall St has no position in any stocks mentioned.
*Interactive Brokers Rated Lowest Cost Broker by StockBrokers.com Annual Online Review 2020
Have feedback on this article? Concerned about the content? Get in touch with us directly. Alternatively, email editorial-team@simplywallst.com.
About DSM:MARK
Masraf Al Rayan (Q.P.S.C.)
Engages in Islamic banking, financing, and investing activities in Qatar and internationally.
Questionable track record with imperfect balance sheet.

