Advertisement
- Portugal
- /
- Oil and Gas
- /
- ENXTLS:GALP
Assessing Galp Energia (ENXTLS:GALP) Valuation After Recent Share Price Movements

Simply Wall St
Reviewed by Kshitija Bhandaru
Galp Energia SGPS (ENXTLS:GALP) shares have shown some movement recently, raising questions around what is driving investor interest. Many are looking at the stock’s performance over the past month to spot possible trends.
See our latest analysis for Galp Energia SGPS.
Zooming out, Galp Energia SGPS’s share price has hovered near its current levels over the past month. However, stepping back, the company has delivered a remarkable 149% total return for shareholders over the past five years. While price momentum has recently cooled, that long-term run hints at investor belief in Galp's ability to adapt and grow through shifting market conditions.
If Galp’s journey has piqued your curiosity, it could be the perfect time to broaden your perspective and discover fast growing stocks with high insider ownership
But with its impressive long-term gains and fairly muted recent performance, is Galp Energia SGPS now trading below its true value, or has the market already factored in all future growth? Is this a rare chance, or has opportunity passed?
Price-to-Earnings of 11.4x: Is it justified?
Galp Energia SGPS currently trades at a price-to-earnings (P/E) ratio of 11.4, noticeably below the European Oil and Gas industry average of 14.3. At a last close price of €16, the stock appears undervalued compared to its sector peers.
The P/E ratio compares a company’s share price to its per-share earnings and is a key metric for assessing how the market values future profit potential. For energy sector companies like Galp, it reflects investor expectations about earnings stability and growth in a volatile industry.
This relatively low multiple suggests the market is pricing in limited earnings growth ahead or possibly discounting recent performance fluctuations. However, when considered against peers in the broader European industry, Galp stands out as better value. This could indicate the market is being cautious about its prospects.
Result: Price-to-Earnings of 11.4 (UNDERVALUED / ABOUT RIGHT)
Explore the SWS fair ratio for Galp Energia SGPS
However, Galp still faces risks, including slowing revenue growth and recent muted share returns. These factors could challenge investor confidence if the trends persist.
Find out about the key risks to this Galp Energia SGPS narrative.
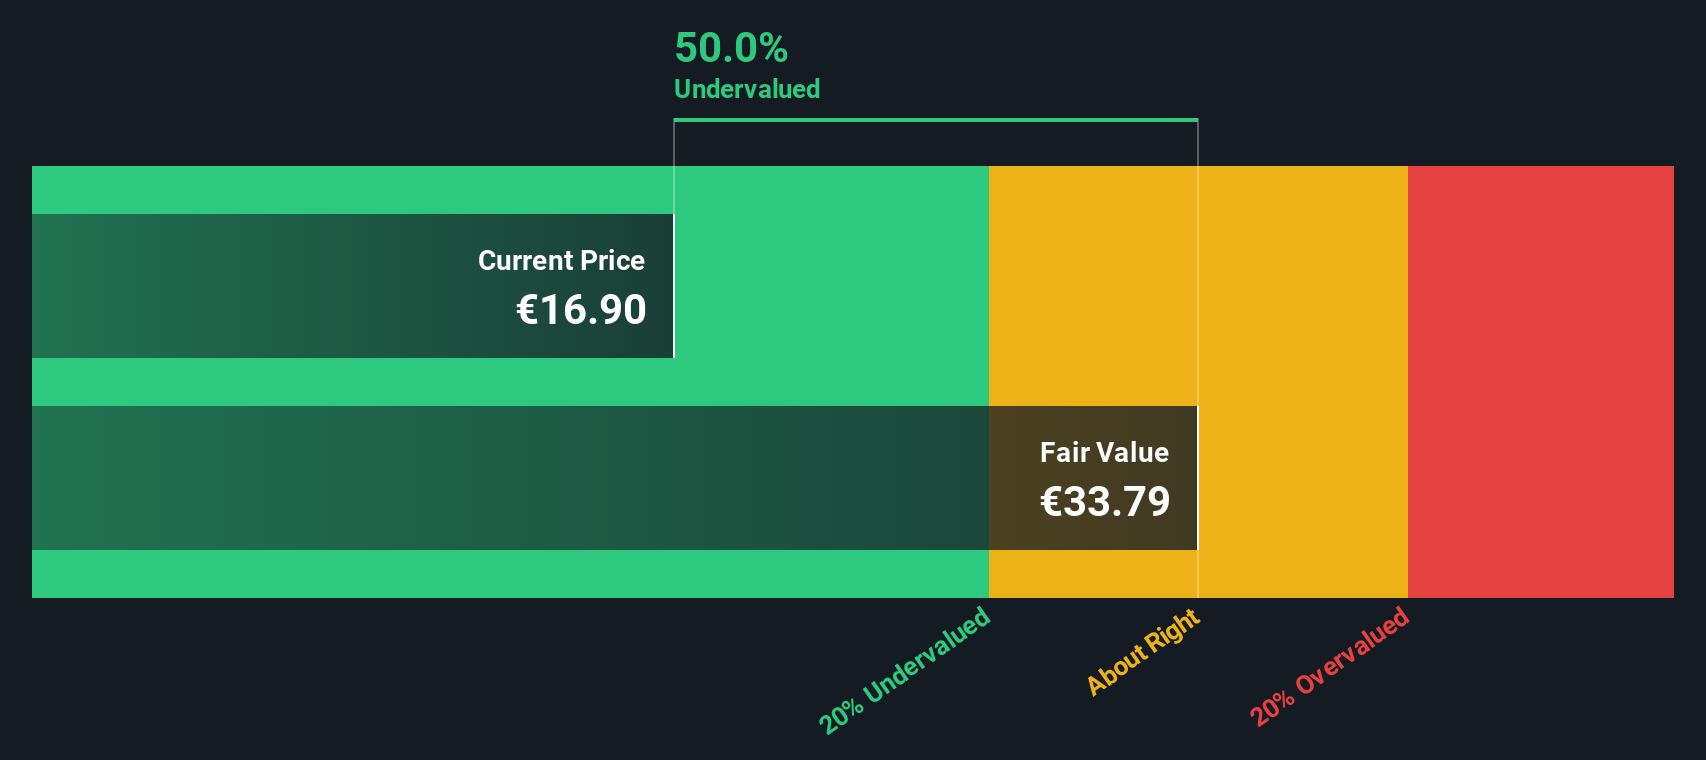
Another View: Discounted Cash Flow Tells a Different Story
While the price-to-earnings ratio shows Galp Energia SGPS trading below its peers, our DCF model estimates fair value at approximately €33.44 per share. This suggests the market could be significantly undervaluing the company based on its future cash flows.
Look into how the SWS DCF model arrives at its fair value.
Simply Wall St performs a discounted cash flow (DCF) on every stock in the world every day (check out Galp Energia SGPS for example). We show the entire calculation in full. You can track the result in your watchlist or portfolio and be alerted when this changes, or use our stock screener to discover undervalued stocks based on their cash flows. If you save a screener we even alert you when new companies match - so you never miss a potential opportunity.
Build Your Own Galp Energia SGPS Narrative
If you see things differently or want to dig into the figures on your own, you can create your personal view in just a few minutes. Do it your way
A great starting point for your Galp Energia SGPS research is our analysis highlighting 1 key reward and 1 important warning sign that could impact your investment decision.
Looking for More Investment Ideas?
Expand your investing horizons and avoid missing out on the latest opportunities. Supercharge your watchlist with companies poised for growth using these powerful tools:
- Tap into hidden potential by checking out these 878 undervalued stocks based on cash flows that are trading well below their real worth and might be primed for future gains.
- Earn steady income and stability through these 18 dividend stocks with yields > 3% offering attractive yields for investors seeking consistent returns in any market climate.
- Pounce on the AI revolution by screening these 25 AI penny stocks making waves in automation, machine learning, and transforming tomorrow's industries.
This article by Simply Wall St is general in nature. We provide commentary based on historical data and analyst forecasts only using an unbiased methodology and our articles are not intended to be financial advice. It does not constitute a recommendation to buy or sell any stock, and does not take account of your objectives, or your financial situation. We aim to bring you long-term focused analysis driven by fundamental data. Note that our analysis may not factor in the latest price-sensitive company announcements or qualitative material. Simply Wall St has no position in any stocks mentioned.
New: Manage All Your Stock Portfolios in One Place
We've created the ultimate portfolio companion for stock investors, and it's free.
• Connect an unlimited number of Portfolios and see your total in one currency
• Be alerted to new Warning Signs or Risks via email or mobile
• Track the Fair Value of your stocks
Have feedback on this article? Concerned about the content? Get in touch with us directly. Alternatively, email editorial-team@simplywallst.com
About ENXTLS:GALP
Galp Energia SGPS
Operates as an integrated energy operator in Portugal and internationally.
Flawless balance sheet and good value.
Similar Companies
Market Insights

Advertisement
Community Narratives
A formidable player in AI and enterprise computing.
Fair Value US$210.00|3.9% overvalued
CO
Community Contributor
IREN's Bold Moves in Sustainable Bitcoin Mining & AI Data Centers
Fair Value US$89.00|21.8% undervalued
BL
Community Contributor
Cooling the Champions: The Aussie Tech Behind F1's Victories
Fair Value AU$12.40|40.6% undervalued
TR
Community Contributor