- Poland
- /
- Electric Utilities
- /
- WSE:PGE
Investors in PGE Polska Grupa Energetyczna (WSE:PGE) have unfortunately lost 32% over the last three years


As an investor its worth striving to ensure your overall portfolio beats the market average. But in any portfolio, there are likely to be some stocks that fall short of that benchmark. We regret to report that long term PGE Polska Grupa Energetyczna S.A. (WSE:PGE) shareholders have had that experience, with the share price dropping 32% in three years, versus a market decline of about 1.7%.
With that in mind, it's worth seeing if the company's underlying fundamentals have been the driver of long term performance, or if there are some discrepancies.
Check out our latest analysis for PGE Polska Grupa Energetyczna
To quote Buffett, 'Ships will sail around the world but the Flat Earth Society will flourish. There will continue to be wide discrepancies between price and value in the marketplace...' One imperfect but simple way to consider how the market perception of a company has shifted is to compare the change in the earnings per share (EPS) with the share price movement.
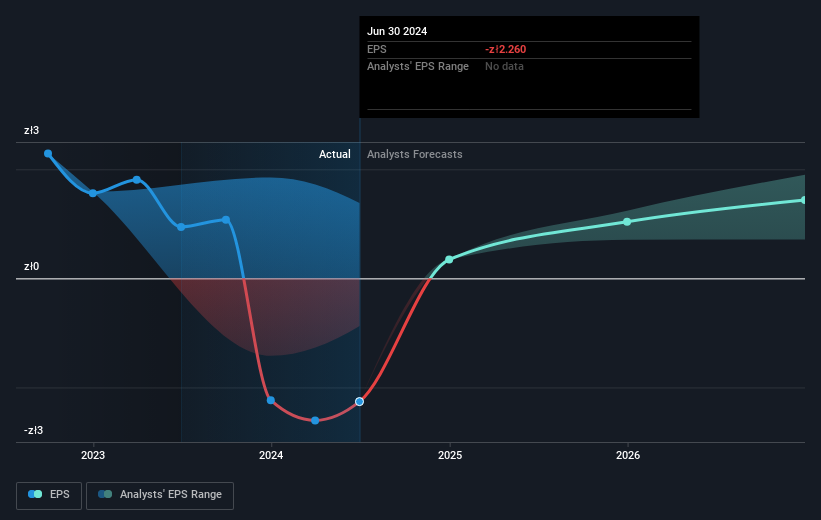
PGE Polska Grupa Energetyczna saw its share price decline over the three years in which its EPS also dropped, falling to a loss. This was, in part, due to extraordinary items impacting earnings. Due to the loss, it's not easy to use EPS as a reliable guide to the business. But it's safe to say we'd generally expect the share price to be lower as a result!
The company's earnings per share (over time) is depicted in the image below (click to see the exact numbers).
Dive deeper into PGE Polska Grupa Energetyczna's key metrics by checking this interactive graph of PGE Polska Grupa Energetyczna's earnings, revenue and cash flow.
A Different Perspective
PGE Polska Grupa Energetyczna shareholders are down 1.0% for the year, but the market itself is up 22%. However, keep in mind that even the best stocks will sometimes underperform the market over a twelve month period. Unfortunately, longer term shareholders are suffering worse, given the loss of 3% doled out over the last five years. We'd need to see some sustained improvements in the key metrics before we could muster much enthusiasm. You might want to assess this data-rich visualization of its earnings, revenue and cash flow.
If you are like me, then you will not want to miss this free list of undervalued small caps that insiders are buying.
Please note, the market returns quoted in this article reflect the market weighted average returns of stocks that currently trade on Polish exchanges.
New: Manage All Your Stock Portfolios in One Place
We've created the ultimate portfolio companion for stock investors, and it's free.
• Connect an unlimited number of Portfolios and see your total in one currency
• Be alerted to new Warning Signs or Risks via email or mobile
• Track the Fair Value of your stocks
Have feedback on this article? Concerned about the content? Get in touch with us directly. Alternatively, email editorial-team (at) simplywallst.com.
This article by Simply Wall St is general in nature. We provide commentary based on historical data and analyst forecasts only using an unbiased methodology and our articles are not intended to be financial advice. It does not constitute a recommendation to buy or sell any stock, and does not take account of your objectives, or your financial situation. We aim to bring you long-term focused analysis driven by fundamental data. Note that our analysis may not factor in the latest price-sensitive company announcements or qualitative material. Simply Wall St has no position in any stocks mentioned.
About WSE:PGE
PGE Polska Grupa Energetyczna
Engages in the production and distribution of electricity and heat in Poland.
Adequate balance sheet and fair value.
Similar Companies
Market Insights

Community Narratives
