Talex S.A.'s (WSE:TLX) On An Uptrend But Financial Prospects Look Pretty Weak: Is The Stock Overpriced?

Talex (WSE:TLX) has had a great run on the share market with its stock up by a significant 18% over the last three months. We, however wanted to have a closer look at its key financial indicators as the markets usually pay for long-term fundamentals, and in this case, they don't look very promising. Specifically, we decided to study Talex's ROE in this article.
Return on equity or ROE is a key measure used to assess how efficiently a company's management is utilizing the company's capital. In short, ROE shows the profit each dollar generates with respect to its shareholder investments.
Check out our latest analysis for Talex
How Is ROE Calculated?
Return on equity can be calculated by using the formula:
Return on Equity = Net Profit (from continuing operations) ÷ Shareholders' Equity
So, based on the above formula, the ROE for Talex is:
6.1% = zł3.2m ÷ zł53m (Based on the trailing twelve months to March 2024).
The 'return' is the amount earned after tax over the last twelve months. One way to conceptualize this is that for each PLN1 of shareholders' capital it has, the company made PLN0.06 in profit.
What Has ROE Got To Do With Earnings Growth?
We have already established that ROE serves as an efficient profit-generating gauge for a company's future earnings. Based on how much of its profits the company chooses to reinvest or "retain", we are then able to evaluate a company's future ability to generate profits. Assuming all else is equal, companies that have both a higher return on equity and higher profit retention are usually the ones that have a higher growth rate when compared to companies that don't have the same features.
Talex's Earnings Growth And 6.1% ROE
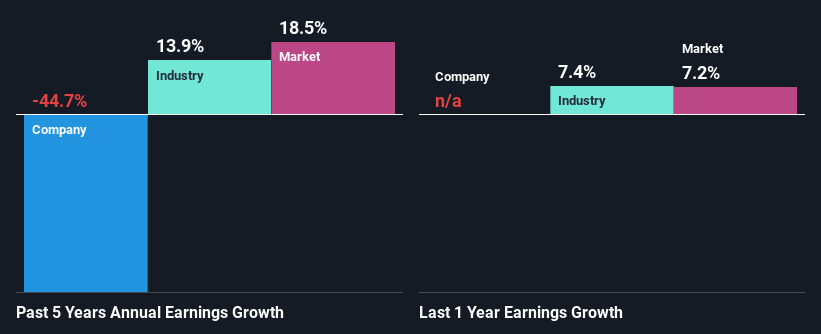
On the face of it, Talex's ROE is not much to talk about. We then compared the company's ROE to the broader industry and were disappointed to see that the ROE is lower than the industry average of 11%. For this reason, Talex's five year net income decline of 45% is not surprising given its lower ROE. We reckon that there could also be other factors at play here. For instance, the company has a very high payout ratio, or is faced with competitive pressures.
That being said, we compared Talex's performance with the industry and were concerned when we found that while the company has shrunk its earnings, the industry has grown its earnings at a rate of 14% in the same 5-year period.
The basis for attaching value to a company is, to a great extent, tied to its earnings growth. It’s important for an investor to know whether the market has priced in the company's expected earnings growth (or decline). By doing so, they will have an idea if the stock is headed into clear blue waters or if swampy waters await. One good indicator of expected earnings growth is the P/E ratio which determines the price the market is willing to pay for a stock based on its earnings prospects. So, you may want to check if Talex is trading on a high P/E or a low P/E, relative to its industry.
Is Talex Using Its Retained Earnings Effectively?
Talex's high three-year median payout ratio of 133% suggests that the company is depleting its resources to keep up its dividend payments, and this shows in its shrinking earnings. Paying a dividend beyond their means is usually not viable over the long term. Our risks dashboard should have the 5 risks we have identified for Talex.
Moreover, Talex has been paying dividends for at least ten years or more suggesting that management must have perceived that the shareholders prefer dividends over earnings growth.
Conclusion
In total, we would have a hard think before deciding on any investment action concerning Talex. Particularly, its ROE is a huge disappointment, not to mention its lack of proper reinvestment into the business. As a result its earnings growth has also been quite disappointing. Until now, we have only just grazed the surface of the company's past performance by looking at the company's fundamentals. So it may be worth checking this free detailed graph of Talex's past earnings, as well as revenue and cash flows to get a deeper insight into the company's performance.
Mobile Infrastructure for Defense and Disaster
The next wave in robotics isn't humanoid. Its fully autonomous towers delivering 5G, ISR, and radar in under 30 minutes, anywhere.
Get the investor briefing before the next round of contracts
Sponsored On Behalf of CiTechValuation is complex, but we're here to simplify it.
Discover if Talex might be undervalued or overvalued with our detailed analysis, featuring fair value estimates, potential risks, dividends, insider trades, and its financial condition.
Access Free AnalysisHave feedback on this article? Concerned about the content? Get in touch with us directly. Alternatively, email editorial-team (at) simplywallst.com.
This article by Simply Wall St is general in nature. We provide commentary based on historical data and analyst forecasts only using an unbiased methodology and our articles are not intended to be financial advice. It does not constitute a recommendation to buy or sell any stock, and does not take account of your objectives, or your financial situation. We aim to bring you long-term focused analysis driven by fundamental data. Note that our analysis may not factor in the latest price-sensitive company announcements or qualitative material. Simply Wall St has no position in any stocks mentioned.
About WSE:TLX
Flawless balance sheet and slightly overvalued.
Market Insights

Weekly Picks

THE KINGDOM OF BROWN GOODS: WHY MGPI IS BEING CRUSHED BY INVENTORY & PRIMED FOR RESURRECTION


Why Vertical Aerospace (NYSE: EVTL) is Worth Possibly Over 13x its Current Price


The Quiet Giant That Became AI’s Power Grid
Recently Updated Narratives


Fiverr International will transform the freelance industry with AI-powered growth

Jackson Financial Stock: When Insurance Math Meets a Shifting Claims Landscape

Stride Stock: Online Education Finds Its Second Act
Popular Narratives


MicroVision will explode future revenue by 380.37% with a vision towards success


Crazy Undervalued 42 Baggers Silver Play (Active & Running Mine)


NVDA: Expanding AI Demand Will Drive Major Data Center Investments Through 2026
Trending Discussion
<html><head></head><body><div dir="auto">This is true here, but always true in the case of Alpha leaders. Often is takes a turn or two to get it right, like Gates to Nardella,  or Anton to Pinchar. This is when succession planning has failed or never happened. </div><div><br></div> </body></html>