
Advertisement
- Poland
- /
- Retail Distributors
- /
- WSE:CAR
Inter Cars S.A.'s (WSE:CAR) Intrinsic Value Is Potentially 37% Above Its Share Price

Key Insights
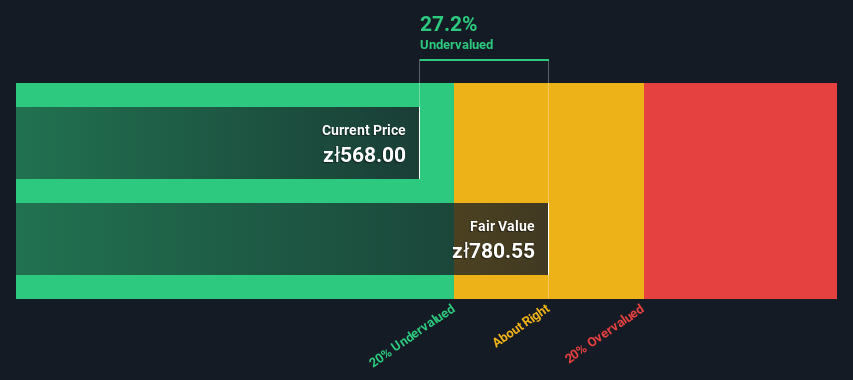
- Inter Cars' estimated fair value is zł781 based on 2 Stage Free Cash Flow to Equity
- Current share price of zł568 suggests Inter Cars is potentially 27% undervalued
- Our fair value estimate is 8.9% higher than Inter Cars' analyst price target of zł717
In this article we are going to estimate the intrinsic value of Inter Cars S.A. (WSE:CAR) by taking the expected future cash flows and discounting them to their present value. One way to achieve this is by employing the Discounted Cash Flow (DCF) model. Before you think you won't be able to understand it, just read on! It's actually much less complex than you'd imagine.
Remember though, that there are many ways to estimate a company's value, and a DCF is just one method. If you still have some burning questions about this type of valuation, take a look at the Simply Wall St analysis model.
Check out our latest analysis for Inter Cars
The Method
We're using the 2-stage growth model, which simply means we take in account two stages of company's growth. In the initial period the company may have a higher growth rate and the second stage is usually assumed to have a stable growth rate. To start off with, we need to estimate the next ten years of cash flows. Where possible we use analyst estimates, but when these aren't available we extrapolate the previous free cash flow (FCF) from the last estimate or reported value. We assume companies with shrinking free cash flow will slow their rate of shrinkage, and that companies with growing free cash flow will see their growth rate slow, over this period. We do this to reflect that growth tends to slow more in the early years than it does in later years.
A DCF is all about the idea that a dollar in the future is less valuable than a dollar today, and so the sum of these future cash flows is then discounted to today's value:
10-year free cash flow (FCF) forecast
| 2024 | 2025 | 2026 | 2027 | 2028 | 2029 | 2030 | 2031 | 2032 | 2033 | |
| Levered FCF (PLN, Millions) | zł198.7m | zł420.0m | zł737.0m | zł814.5m | zł875.0m | zł929.2m | zł978.7m | zł1.02b | zł1.07b | zł1.11b |
| Growth Rate Estimate Source | Analyst x3 | Analyst x3 | Analyst x2 | Analyst x2 | Est @ 7.43% | Est @ 6.19% | Est @ 5.33% | Est @ 4.72% | Est @ 4.30% | Est @ 4.00% |
| Present Value (PLN, Millions) Discounted @ 10% | zł180 | zł347 | zł553 | zł555 | zł542 | zł522 | zł500 | zł476 | zł451 | zł426 |
("Est" = FCF growth rate estimated by Simply Wall St)
Present Value of 10-year Cash Flow (PVCF) = zł4.6b
After calculating the present value of future cash flows in the initial 10-year period, we need to calculate the Terminal Value, which accounts for all future cash flows beyond the first stage. For a number of reasons a very conservative growth rate is used that cannot exceed that of a country's GDP growth. In this case we have used the 5-year average of the 10-year government bond yield (3.3%) to estimate future growth. In the same way as with the 10-year 'growth' period, we discount future cash flows to today's value, using a cost of equity of 10%.
Terminal Value (TV)= FCF2033 × (1 + g) ÷ (r – g) = zł1.1b× (1 + 3.3%) ÷ (10%– 3.3%) = zł17b
Present Value of Terminal Value (PVTV)= TV / (1 + r)10= zł17b÷ ( 1 + 10%)10= zł6.5b
The total value, or equity value, is then the sum of the present value of the future cash flows, which in this case is zł11b. To get the intrinsic value per share, we divide this by the total number of shares outstanding. Compared to the current share price of zł568, the company appears a touch undervalued at a 27% discount to where the stock price trades currently. The assumptions in any calculation have a big impact on the valuation, so it is better to view this as a rough estimate, not precise down to the last cent.
Important Assumptions
The calculation above is very dependent on two assumptions. The first is the discount rate and the other is the cash flows. You don't have to agree with these inputs, I recommend redoing the calculations yourself and playing with them. The DCF also does not consider the possible cyclicality of an industry, or a company's future capital requirements, so it does not give a full picture of a company's potential performance. Given that we are looking at Inter Cars as potential shareholders, the cost of equity is used as the discount rate, rather than the cost of capital (or weighted average cost of capital, WACC) which accounts for debt. In this calculation we've used 10%, which is based on a levered beta of 1.077. Beta is a measure of a stock's volatility, compared to the market as a whole. We get our beta from the industry average beta of globally comparable companies, with an imposed limit between 0.8 and 2.0, which is a reasonable range for a stable business.
SWOT Analysis for Inter Cars
Strength
- Debt is well covered by earnings.
Weakness
- Earnings growth over the past year underperformed the Retail Distributors industry.
- Dividend is low compared to the top 25% of dividend payers in the Retail Distributors market.
Opportunity
- Annual earnings are forecast to grow faster than the Polish market.
- Good value based on P/E ratio and estimated fair value.
Threat
- Debt is not well covered by operating cash flow.
- Revenue is forecast to grow slower than 20% per year.
Moving On:
Whilst important, the DCF calculation is only one of many factors that you need to assess for a company. It's not possible to obtain a foolproof valuation with a DCF model. Instead the best use for a DCF model is to test certain assumptions and theories to see if they would lead to the company being undervalued or overvalued. If a company grows at a different rate, or if its cost of equity or risk free rate changes sharply, the output can look very different. Can we work out why the company is trading at a discount to intrinsic value? For Inter Cars, we've compiled three pertinent items you should consider:
- Risks: For example, we've discovered 1 warning sign for Inter Cars that you should be aware of before investing here.
- Future Earnings: How does CAR's growth rate compare to its peers and the wider market? Dig deeper into the analyst consensus number for the upcoming years by interacting with our free analyst growth expectation chart.
- Other Solid Businesses: Low debt, high returns on equity and good past performance are fundamental to a strong business. Why not explore our interactive list of stocks with solid business fundamentals to see if there are other companies you may not have considered!
PS. The Simply Wall St app conducts a discounted cash flow valuation for every stock on the WSE every day. If you want to find the calculation for other stocks just search here.
New: AI Stock Screener & Alerts
Our new AI Stock Screener scans the market every day to uncover opportunities.
• Dividend Powerhouses (3%+ Yield)
• Undervalued Small Caps with Insider Buying
• High growth Tech and AI Companies
Or build your own from over 50 metrics.
Have feedback on this article? Concerned about the content? Get in touch with us directly. Alternatively, email editorial-team (at) simplywallst.com.
This article by Simply Wall St is general in nature. We provide commentary based on historical data and analyst forecasts only using an unbiased methodology and our articles are not intended to be financial advice. It does not constitute a recommendation to buy or sell any stock, and does not take account of your objectives, or your financial situation. We aim to bring you long-term focused analysis driven by fundamental data. Note that our analysis may not factor in the latest price-sensitive company announcements or qualitative material. Simply Wall St has no position in any stocks mentioned.
About WSE:CAR
Undervalued with proven track record.
Similar Companies
Market Insights

Advertisement
Community Narratives
Pinterest will surge as advertising innovations ignite revenue growth
Fair Value US$42.63|27.1% undervalued
BR
Community Contributor
Brambles' Revenue Set to Climb 14% with Profit Margins Following
Fair Value AU$21.90|4.9% overvalued
RO
Community Contributor
Challenging Future for STG as Organic Sales Decline by 8.8%
Fair Value DKK 116.13|26.8% undervalued
KA
Community Contributor