Is Red Carpet Media Group S.A.'s (WSE:RCM) Latest Stock Performance A Reflection Of Its Financial Health?


Red Carpet Media Group's (WSE:RCM) stock is up by a considerable 21% over the past week. Given that the market rewards strong financials in the long-term, we wonder if that is the case in this instance. In this article, we decided to focus on Red Carpet Media Group's ROE.
ROE or return on equity is a useful tool to assess how effectively a company can generate returns on the investment it received from its shareholders. In short, ROE shows the profit each dollar generates with respect to its shareholder investments.
Check out our latest analysis for Red Carpet Media Group
How To Calculate Return On Equity?
ROE can be calculated by using the formula:
Return on Equity = Net Profit (from continuing operations) ÷ Shareholders' Equity
So, based on the above formula, the ROE for Red Carpet Media Group is:
26% = zł4.1m ÷ zł16m (Based on the trailing twelve months to December 2023).
The 'return' is the yearly profit. So, this means that for every PLN1 of its shareholder's investments, the company generates a profit of PLN0.26.
What Has ROE Got To Do With Earnings Growth?
Thus far, we have learned that ROE measures how efficiently a company is generating its profits. We now need to evaluate how much profit the company reinvests or "retains" for future growth which then gives us an idea about the growth potential of the company. Assuming everything else remains unchanged, the higher the ROE and profit retention, the higher the growth rate of a company compared to companies that don't necessarily bear these characteristics.
Red Carpet Media Group's Earnings Growth And 26% ROE
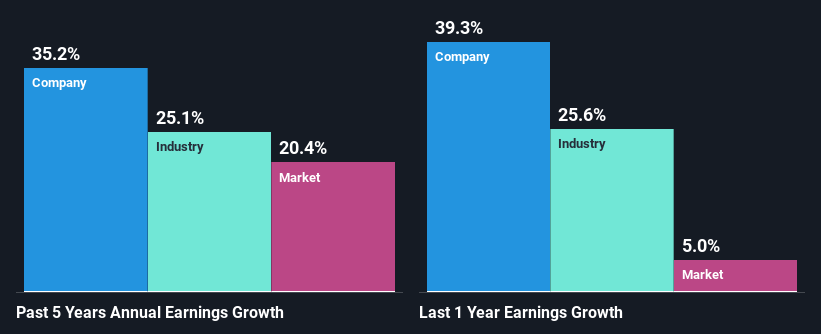
Firstly, we acknowledge that Red Carpet Media Group has a significantly high ROE. Second, a comparison with the average ROE reported by the industry of 18% also doesn't go unnoticed by us. So, the substantial 35% net income growth seen by Red Carpet Media Group over the past five years isn't overly surprising.
As a next step, we compared Red Carpet Media Group's net income growth with the industry, and pleasingly, we found that the growth seen by the company is higher than the average industry growth of 25%.
Earnings growth is an important metric to consider when valuing a stock. The investor should try to establish if the expected growth or decline in earnings, whichever the case may be, is priced in. Doing so will help them establish if the stock's future looks promising or ominous. One good indicator of expected earnings growth is the P/E ratio which determines the price the market is willing to pay for a stock based on its earnings prospects. So, you may want to check if Red Carpet Media Group is trading on a high P/E or a low P/E, relative to its industry.
Is Red Carpet Media Group Efficiently Re-investing Its Profits?
Red Carpet Media Group doesn't pay any dividend currently which essentially means that it has been reinvesting all of its profits into the business. This definitely contributes to the high earnings growth number that we discussed above.
Conclusion
On the whole, we feel that Red Carpet Media Group's performance has been quite good. Particularly, we like that the company is reinvesting heavily into its business, and at a high rate of return. Unsurprisingly, this has led to an impressive earnings growth. If the company continues to grow its earnings the way it has, that could have a positive impact on its share price given how earnings per share influence long-term share prices. Remember, the price of a stock is also dependent on the perceived risk. Therefore investors must keep themselves informed about the risks involved before investing in any company. You can see the 4 risks we have identified for Red Carpet Media Group by visiting our risks dashboard for free on our platform here.
New: AI Stock Screener & Alerts
Our new AI Stock Screener scans the market every day to uncover opportunities.
• Dividend Powerhouses (3%+ Yield)
• Undervalued Small Caps with Insider Buying
• High growth Tech and AI Companies
Or build your own from over 50 metrics.
Have feedback on this article? Concerned about the content? Get in touch with us directly. Alternatively, email editorial-team (at) simplywallst.com.
This article by Simply Wall St is general in nature. We provide commentary based on historical data and analyst forecasts only using an unbiased methodology and our articles are not intended to be financial advice. It does not constitute a recommendation to buy or sell any stock, and does not take account of your objectives, or your financial situation. We aim to bring you long-term focused analysis driven by fundamental data. Note that our analysis may not factor in the latest price-sensitive company announcements or qualitative material. Simply Wall St has no position in any stocks mentioned.
About WSE:RCM
Red Carpet Media Group
Engages in the production and distribution of television programs in Poland, the United States, and Canada.
Excellent balance sheet with proven track record.
Market Insights

Community Narratives


