
Advertisement
Gremi Media S.A.'s (WSE:GME) Stock Going Strong But Fundamentals Look Weak: What Implications Could This Have On The Stock?

Gremi Media's (WSE:GME) stock is up by a considerable 66% over the past three months. However, we decided to pay close attention to its weak financials as we are doubtful that the current momentum will keep up, given the scenario. Specifically, we decided to study Gremi Media's ROE in this article.
Return on Equity or ROE is a test of how effectively a company is growing its value and managing investors’ money. In other words, it is a profitability ratio which measures the rate of return on the capital provided by the company's shareholders.
How Is ROE Calculated?
ROE can be calculated by using the formula:
Return on Equity = Net Profit (from continuing operations) ÷ Shareholders' Equity
So, based on the above formula, the ROE for Gremi Media is:
0.7% = zł764k ÷ zł103m (Based on the trailing twelve months to March 2025).
The 'return' refers to a company's earnings over the last year. One way to conceptualize this is that for each PLN1 of shareholders' capital it has, the company made PLN0.01 in profit.
View our latest analysis for Gremi Media
What Is The Relationship Between ROE And Earnings Growth?
We have already established that ROE serves as an efficient profit-generating gauge for a company's future earnings. We now need to evaluate how much profit the company reinvests or "retains" for future growth which then gives us an idea about the growth potential of the company. Generally speaking, other things being equal, firms with a high return on equity and profit retention, have a higher growth rate than firms that don’t share these attributes.
Gremi Media's Earnings Growth And 0.7% ROE
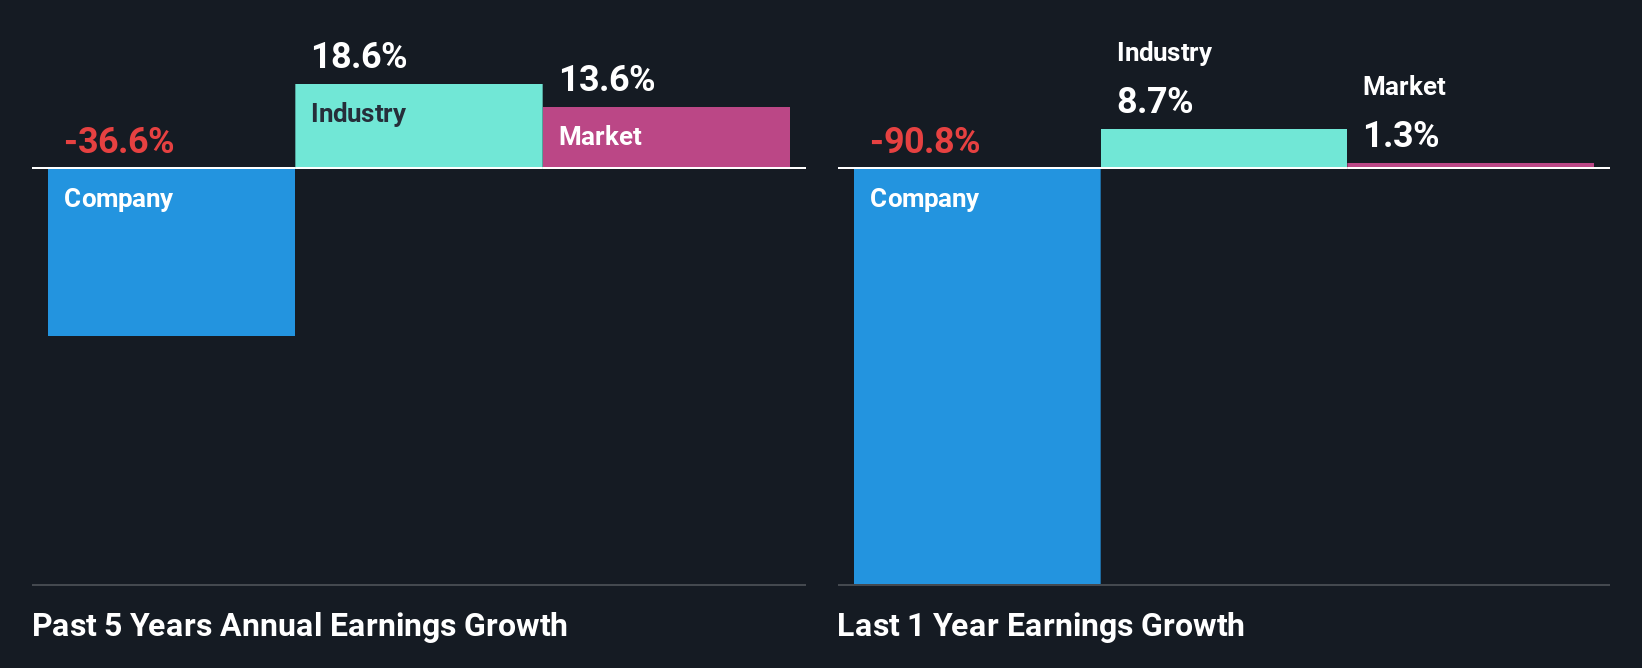
As you can see, Gremi Media's ROE looks pretty weak. Not just that, even compared to the industry average of 16%, the company's ROE is entirely unremarkable. Given the circumstances, the significant decline in net income by 37% seen by Gremi Media over the last five years is not surprising. However, there could also be other factors causing the earnings to decline. For example, the business has allocated capital poorly, or that the company has a very high payout ratio.
So, as a next step, we compared Gremi Media's performance against the industry and were disappointed to discover that while the company has been shrinking its earnings, the industry has been growing its earnings at a rate of 19% over the last few years.
Earnings growth is a huge factor in stock valuation. It’s important for an investor to know whether the market has priced in the company's expected earnings growth (or decline). Doing so will help them establish if the stock's future looks promising or ominous. If you're wondering about Gremi Media's's valuation, check out this gauge of its price-to-earnings ratio, as compared to its industry.
Is Gremi Media Efficiently Re-investing Its Profits?
Gremi Media's declining earnings is not surprising given how the company is spending most of its profits in paying dividends, judging by its three-year median payout ratio of 67% (or a retention ratio of 33%). With only a little being reinvested into the business, earnings growth would obviously be low or non-existent. To know the 5 risks we have identified for Gremi Media visit our risks dashboard for free.
In addition, Gremi Media has been paying dividends over a period of four years suggesting that keeping up dividend payments is preferred by the management even though earnings have been in decline.
Summary
On the whole, Gremi Media's performance is quite a big let-down. Because the company is not reinvesting much into the business, and given the low ROE, it's not surprising to see the lack or absence of growth in its earnings. Up till now, we've only made a short study of the company's growth data. You can do your own research on Gremi Media and see how it has performed in the past by looking at this FREE detailed graph of past earnings, revenue and cash flows.
New: Manage All Your Stock Portfolios in One Place
We've created the ultimate portfolio companion for stock investors, and it's free.
• Connect an unlimited number of Portfolios and see your total in one currency
• Be alerted to new Warning Signs or Risks via email or mobile
• Track the Fair Value of your stocks
Have feedback on this article? Concerned about the content? Get in touch with us directly. Alternatively, email editorial-team (at) simplywallst.com.
This article by Simply Wall St is general in nature. We provide commentary based on historical data and analyst forecasts only using an unbiased methodology and our articles are not intended to be financial advice. It does not constitute a recommendation to buy or sell any stock, and does not take account of your objectives, or your financial situation. We aim to bring you long-term focused analysis driven by fundamental data. Note that our analysis may not factor in the latest price-sensitive company announcements or qualitative material. Simply Wall St has no position in any stocks mentioned.
About WSE:GME
Gremi Media
Operates as a media platform in the business-finance-law segment in Poland.
Flawless balance sheet with moderate risk.
Market Insights


Advertisement
Community Narratives
Gaxos.ai: Early-Stage AI Innovator in Gaming & Health
Fair Value US$2.21|5.9% undervalued
JO
Community Contributor
After the AI Party: A Sobering Look at Microsoft's Future
Fair Value US$500.00|1.4% overvalued
PI
Community Contributor
Amazon's Future Rises as Stock Price Falls: A Long-Term Investment Vision
Fair Value US$234.75|2.5% undervalued
ZW
Community Contributor
