
Advertisement
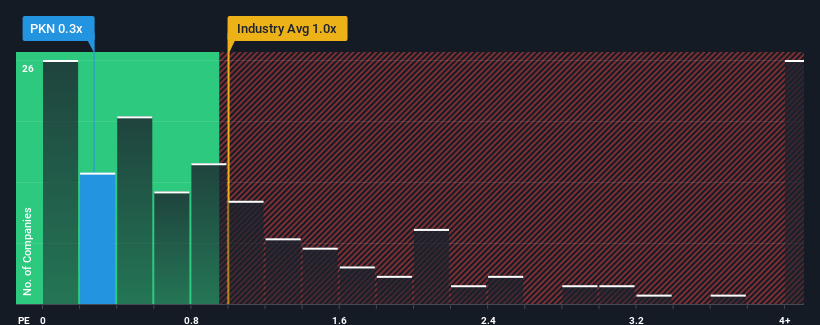
When you see that almost half of the companies in the Oil and Gas industry in Poland have price-to-sales ratios (or "P/S") above 1x, Orlen S.A. (WSE:PKN) looks to be giving off some buy signals with its 0.3x P/S ratio. Nonetheless, we'd need to dig a little deeper to determine if there is a rational basis for the reduced P/S.
Our free stock report includes 3 warning signs investors should be aware of before investing in Orlen. Read for free now.View our latest analysis for Orlen
How Orlen Has Been Performing
With revenue that's retreating more than the industry's average of late, Orlen has been very sluggish. Perhaps the market isn't expecting future revenue performance to improve, which has kept the P/S suppressed. You'd much rather the company improve its revenue performance if you still believe in the business. Or at the very least, you'd be hoping the revenue slide doesn't get any worse if your plan is to pick up some stock while it's out of favour.
Want the full picture on analyst estimates for the company? Then our free report on Orlen will help you uncover what's on the horizon.What Are Revenue Growth Metrics Telling Us About The Low P/S?
Orlen's P/S ratio would be typical for a company that's only expected to deliver limited growth, and importantly, perform worse than the industry.
In reviewing the last year of financials, we were disheartened to see the company's revenues fell to the tune of 21%. Still, the latest three year period has seen an excellent 125% overall rise in revenue, in spite of its unsatisfying short-term performance. Although it's been a bumpy ride, it's still fair to say the revenue growth recently has been more than adequate for the company.
Shifting to the future, estimates from the nine analysts covering the company suggest revenue growth is heading into negative territory, declining 1.2% per annum over the next three years. Meanwhile, the broader industry is forecast to expand by 2.0% each year, which paints a poor picture.
With this in consideration, we find it intriguing that Orlen's P/S is closely matching its industry peers. Nonetheless, there's no guarantee the P/S has reached a floor yet with revenue going in reverse. There's potential for the P/S to fall to even lower levels if the company doesn't improve its top-line growth.
What We Can Learn From Orlen's P/S?
Using the price-to-sales ratio alone to determine if you should sell your stock isn't sensible, however it can be a practical guide to the company's future prospects.
As we suspected, our examination of Orlen's analyst forecasts revealed that its outlook for shrinking revenue is contributing to its low P/S. Right now shareholders are accepting the low P/S as they concede future revenue probably won't provide any pleasant surprises. Unless there's material change, it's hard to envision a situation where the stock price will rise drastically.
Don't forget that there may be other risks. For instance, we've identified 3 warning signs for Orlen (1 is concerning) you should be aware of.
If strong companies turning a profit tickle your fancy, then you'll want to check out this free list of interesting companies that trade on a low P/E (but have proven they can grow earnings).
New: AI Stock Screener & Alerts
Our new AI Stock Screener scans the market every day to uncover opportunities.
• Dividend Powerhouses (3%+ Yield)
• Undervalued Small Caps with Insider Buying
• High growth Tech and AI Companies
Or build your own from over 50 metrics.
Have feedback on this article? Concerned about the content? Get in touch with us directly. Alternatively, email editorial-team (at) simplywallst.com.
This article by Simply Wall St is general in nature. We provide commentary based on historical data and analyst forecasts only using an unbiased methodology and our articles are not intended to be financial advice. It does not constitute a recommendation to buy or sell any stock, and does not take account of your objectives, or your financial situation. We aim to bring you long-term focused analysis driven by fundamental data. Note that our analysis may not factor in the latest price-sensitive company announcements or qualitative material. Simply Wall St has no position in any stocks mentioned.
About WSE:PKN
Orlen
Operates in refining, petrochemical, energy, retail, gas, and upstream business.
Flawless balance sheet second-rate dividend payer.
Similar Companies
Market Insights

Advertisement
Community Narratives
MINISO's fair value is projected at 26.69 with an anticipated PE ratio shift of 20x
Fair Value US$24.03|11.4% undervalued
BE
Community Contributor
Procter & Gamble: A Dividend Giant Facing Slowing Growth
Fair Value US$119.81|23.5% overvalued
AN
Community Contributor
Eli Lilly's Future Growth Driven by Tirzepatide and Favorable Market Conditions
Fair Value US$1.19k|14.0% undervalued
EA
Community Contributor