

David Iben put it well when he said, 'Volatility is not a risk we care about. What we care about is avoiding the permanent loss of capital.' When we think about how risky a company is, we always like to look at its use of debt, since debt overload can lead to ruin. Importantly, Bras S.A. (WSE:BSA) does carry debt. But the real question is whether this debt is making the company risky.
When Is Debt A Problem?
Debt assists a business until the business has trouble paying it off, either with new capital or with free cash flow. If things get really bad, the lenders can take control of the business. However, a more usual (but still expensive) situation is where a company must dilute shareholders at a cheap share price simply to get debt under control. Having said that, the most common situation is where a company manages its debt reasonably well - and to its own advantage. The first step when considering a company's debt levels is to consider its cash and debt together.
View our latest analysis for Bras
How Much Debt Does Bras Carry?
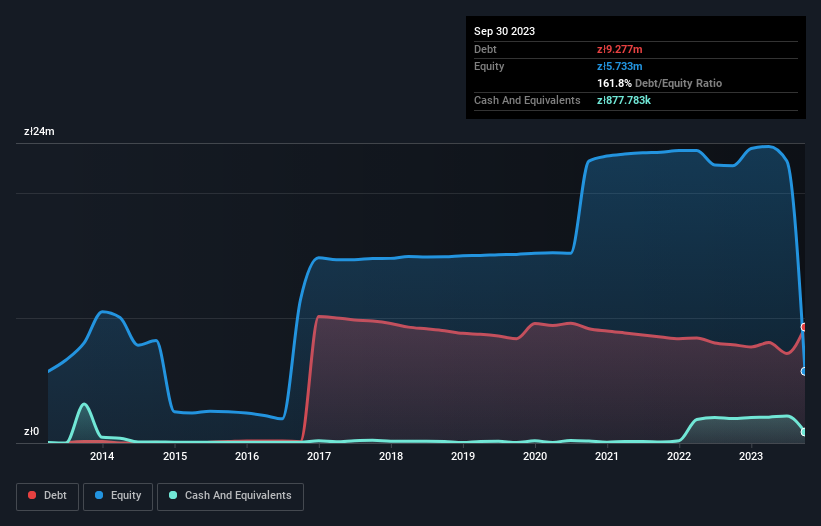
You can click the graphic below for the historical numbers, but it shows that as of September 2023 Bras had zł9.28m of debt, an increase on zł7.86m, over one year. However, it also had zł877.8k in cash, and so its net debt is zł8.40m.
How Healthy Is Bras' Balance Sheet?
Zooming in on the latest balance sheet data, we can see that Bras had liabilities of zł5.27m due within 12 months and liabilities of zł9.28m due beyond that. Offsetting these obligations, it had cash of zł877.8k as well as receivables valued at zł1.96m due within 12 months. So it has liabilities totalling zł11.7m more than its cash and near-term receivables, combined.
This deficit is considerable relative to its market capitalization of zł18.3m, so it does suggest shareholders should keep an eye on Bras' use of debt. This suggests shareholders would be heavily diluted if the company needed to shore up its balance sheet in a hurry.
We use two main ratios to inform us about debt levels relative to earnings. The first is net debt divided by earnings before interest, tax, depreciation, and amortization (EBITDA), while the second is how many times its earnings before interest and tax (EBIT) covers its interest expense (or its interest cover, for short). Thus we consider debt relative to earnings both with and without depreciation and amortization expenses.
While Bras's debt to EBITDA ratio (4.9) suggests that it uses some debt, its interest cover is very weak, at 2.0, suggesting high leverage. So shareholders should probably be aware that interest expenses appear to have really impacted the business lately. Looking on the bright side, Bras boosted its EBIT by a silky 72% in the last year. Like a mother's loving embrace of a newborn that sort of growth builds resilience, putting the company in a stronger position to manage its debt. When analysing debt levels, the balance sheet is the obvious place to start. But it is Bras's earnings that will influence how the balance sheet holds up in the future. So if you're keen to discover more about its earnings, it might be worth checking out this graph of its long term earnings trend.
Finally, a company can only pay off debt with cold hard cash, not accounting profits. So the logical step is to look at the proportion of that EBIT that is matched by actual free cash flow. During the last three years, Bras generated free cash flow amounting to a very robust 97% of its EBIT, more than we'd expect. That positions it well to pay down debt if desirable to do so.
Our View
Bras's conversion of EBIT to free cash flow was a real positive on this analysis, as was its EBIT growth rate. But truth be told its interest cover had us nibbling our nails. Considering this range of data points, we think Bras is in a good position to manage its debt levels. Having said that, the load is sufficiently heavy that we would recommend any shareholders keep a close eye on it. The balance sheet is clearly the area to focus on when you are analysing debt. However, not all investment risk resides within the balance sheet - far from it. We've identified 4 warning signs with Bras (at least 3 which can't be ignored) , and understanding them should be part of your investment process.
If, after all that, you're more interested in a fast growing company with a rock-solid balance sheet, then check out our list of net cash growth stocks without delay.
If you're looking to trade Bras, open an account with the lowest-cost platform trusted by professionals, Interactive Brokers.
With clients in over 200 countries and territories, and access to 160 markets, IBKR lets you trade stocks, options, futures, forex, bonds and funds from a single integrated account.
Enjoy no hidden fees, no account minimums, and FX conversion rates as low as 0.03%, far better than what most brokers offer.
Sponsored ContentValuation is complex, but we're here to simplify it.
Discover if Bras might be undervalued or overvalued with our detailed analysis, featuring fair value estimates, potential risks, dividends, insider trades, and its financial condition.
Access Free AnalysisHave feedback on this article? Concerned about the content? Get in touch with us directly. Alternatively, email editorial-team (at) simplywallst.com.
This article by Simply Wall St is general in nature. We provide commentary based on historical data and analyst forecasts only using an unbiased methodology and our articles are not intended to be financial advice. It does not constitute a recommendation to buy or sell any stock, and does not take account of your objectives, or your financial situation. We aim to bring you long-term focused analysis driven by fundamental data. Note that our analysis may not factor in the latest price-sensitive company announcements or qualitative material. Simply Wall St has no position in any stocks mentioned.
About WSE:BSA
Fair value low.
Market Insights

Community Narratives
