Wielton (WSE:WLT) pulls back 12% this week, but still delivers shareholders respectable 11% CAGR over 5 years


Wielton S.A. (WSE:WLT) shareholders might be concerned after seeing the share price drop 12% in the last week. On the bright side the share price is up over the last half decade. In that time, it is up 60%, which isn't bad, but is below the market return of 108%. Unfortunately not all shareholders will have held it for the long term, so spare a thought for those caught in the 35% decline over the last twelve months.
In light of the stock dropping 12% in the past week, we want to investigate the longer term story, and see if fundamentals have been the driver of the company's positive five-year return.
While the efficient markets hypothesis continues to be taught by some, it has been proven that markets are over-reactive dynamic systems, and investors are not always rational. By comparing earnings per share (EPS) and share price changes over time, we can get a feel for how investor attitudes to a company have morphed over time.
Over half a decade, Wielton managed to grow its earnings per share at 4.9% a year. This EPS growth is lower than the 10% average annual increase in the share price. So it's fair to assume the market has a higher opinion of the business than it did five years ago. That's not necessarily surprising considering the five-year track record of earnings growth.
The graphic below depicts how EPS has changed over time (unveil the exact values by clicking on the image).
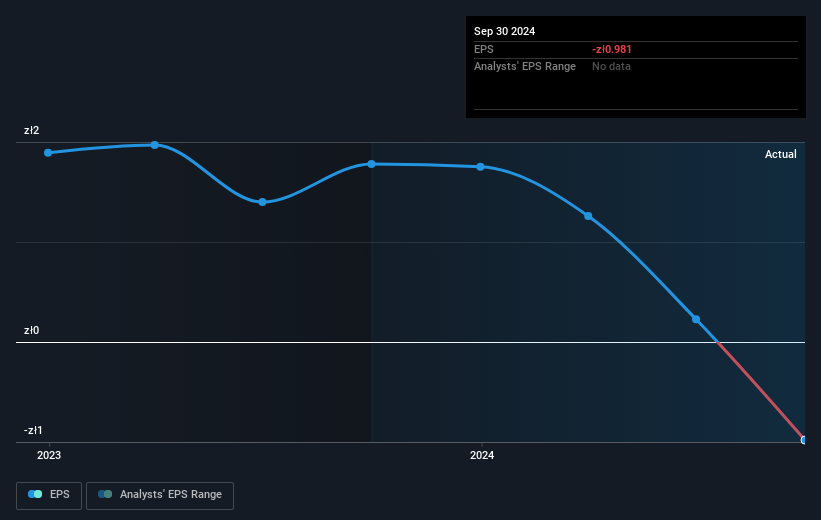
This free interactive report on Wielton's earnings, revenue and cash flow is a great place to start, if you want to investigate the stock further.
What About Dividends?
As well as measuring the share price return, investors should also consider the total shareholder return (TSR). The TSR incorporates the value of any spin-offs or discounted capital raisings, along with any dividends, based on the assumption that the dividends are reinvested. It's fair to say that the TSR gives a more complete picture for stocks that pay a dividend. We note that for Wielton the TSR over the last 5 years was 72%, which is better than the share price return mentioned above. This is largely a result of its dividend payments!
A Different Perspective
Wielton shareholders are down 35% for the year (even including dividends), but the market itself is up 2.2%. Even the share prices of good stocks drop sometimes, but we want to see improvements in the fundamental metrics of a business, before getting too interested. On the bright side, long term shareholders have made money, with a gain of 11% per year over half a decade. It could be that the recent sell-off is an opportunity, so it may be worth checking the fundamental data for signs of a long term growth trend. While it is well worth considering the different impacts that market conditions can have on the share price, there are other factors that are even more important. Like risks, for instance. Every company has them, and we've spotted 3 warning signs for Wielton (of which 1 is a bit concerning!) you should know about.
If you are like me, then you will not want to miss this free list of undervalued small caps that insiders are buying.
Please note, the market returns quoted in this article reflect the market weighted average returns of stocks that currently trade on Polish exchanges.
Valuation is complex, but we're here to simplify it.
Discover if Wielton might be undervalued or overvalued with our detailed analysis, featuring fair value estimates, potential risks, dividends, insider trades, and its financial condition.
Access Free AnalysisHave feedback on this article? Concerned about the content? Get in touch with us directly. Alternatively, email editorial-team (at) simplywallst.com.
This article by Simply Wall St is general in nature. We provide commentary based on historical data and analyst forecasts only using an unbiased methodology and our articles are not intended to be financial advice. It does not constitute a recommendation to buy or sell any stock, and does not take account of your objectives, or your financial situation. We aim to bring you long-term focused analysis driven by fundamental data. Note that our analysis may not factor in the latest price-sensitive company announcements or qualitative material. Simply Wall St has no position in any stocks mentioned.
About WSE:WLT
Wielton
Manufactures and sells semi-trailers, trailers, and car bodies in Europe, Asia, and Africa.
Undervalued low.
Market Insights


Community Narratives

