
Advertisement
- New Zealand
- /
- Logistics
- /
- NZSE:FRW
Are Robust Financials Driving The Recent Rally In Freightways Group Limited's (NZSE:FRW) Stock?
Freightways Group (NZSE:FRW) has had a great run on the share market with its stock up by a significant 17% over the last three months. Since the market usually pay for a company’s long-term fundamentals, we decided to study the company’s key performance indicators to see if they could be influencing the market. In this article, we decided to focus on Freightways Group's ROE.
ROE or return on equity is a useful tool to assess how effectively a company can generate returns on the investment it received from its shareholders. In other words, it is a profitability ratio which measures the rate of return on the capital provided by the company's shareholders.
How Do You Calculate Return On Equity?
The formula for ROE is:
Return on Equity = Net Profit (from continuing operations) ÷ Shareholders' Equity
So, based on the above formula, the ROE for Freightways Group is:
16% = NZ$80m ÷ NZ$500m (Based on the trailing twelve months to June 2025).
The 'return' is the yearly profit. Another way to think of that is that for every NZ$1 worth of equity, the company was able to earn NZ$0.16 in profit.
View our latest analysis for Freightways Group
What Is The Relationship Between ROE And Earnings Growth?
Thus far, we have learned that ROE measures how efficiently a company is generating its profits. Based on how much of its profits the company chooses to reinvest or "retain", we are then able to evaluate a company's future ability to generate profits. Generally speaking, other things being equal, firms with a high return on equity and profit retention, have a higher growth rate than firms that don’t share these attributes.
Freightways Group's Earnings Growth And 16% ROE
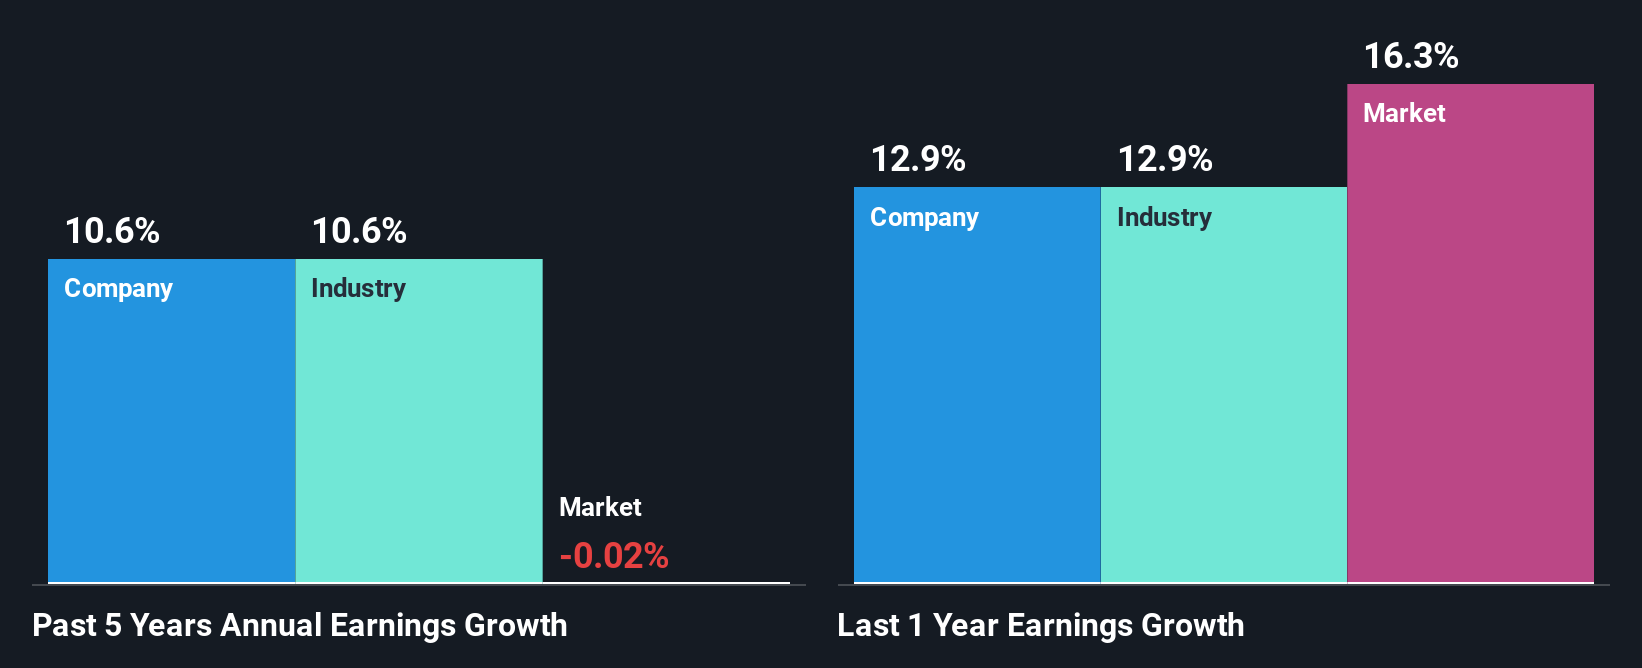
At first glance, Freightways Group seems to have a decent ROE. Even when compared to the industry average of 14% the company's ROE looks quite decent. This probably goes some way in explaining Freightways Group's moderate 11% growth over the past five years amongst other factors.
We then performed a comparison between Freightways Group's net income growth with the industry, which revealed that the company's growth is similar to the average industry growth of 11% in the same 5-year period.
The basis for attaching value to a company is, to a great extent, tied to its earnings growth. What investors need to determine next is if the expected earnings growth, or the lack of it, is already built into the share price. Doing so will help them establish if the stock's future looks promising or ominous. What is FRW worth today? The intrinsic value infographic in our free research report helps visualize whether FRW is currently mispriced by the market.
Is Freightways Group Using Its Retained Earnings Effectively?
The high three-year median payout ratio of 89% (or a retention ratio of 11%) for Freightways Group suggests that the company's growth wasn't really hampered despite it returning most of its income to its shareholders.
Moreover, Freightways Group is determined to keep sharing its profits with shareholders which we infer from its long history of paying a dividend for at least ten years. Upon studying the latest analysts' consensus data, we found that the company is expected to keep paying out approximately 78% of its profits over the next three years. Regardless, the future ROE for Freightways Group is predicted to rise to 23% despite there being not much change expected in its payout ratio.
Conclusion
In total, we are pretty happy with Freightways Group's performance. We are particularly impressed by the considerable earnings growth posted by the company, which was likely backed by its high ROE. While the company is paying out most of its earnings as dividends, it has been able to grow its earnings in spite of it, so that's probably a good sign. We also studied the latest analyst forecasts and found that the company's earnings growth is expected be similar to its current growth rate. Are these analysts expectations based on the broad expectations for the industry, or on the company's fundamentals? Click here to be taken to our analyst's forecasts page for the company.
New: AI Stock Screener & Alerts
Our new AI Stock Screener scans the market every day to uncover opportunities.
• Dividend Powerhouses (3%+ Yield)
• Undervalued Small Caps with Insider Buying
• High growth Tech and AI Companies
Or build your own from over 50 metrics.
Have feedback on this article? Concerned about the content? Get in touch with us directly. Alternatively, email editorial-team (at) simplywallst.com.
This article by Simply Wall St is general in nature. We provide commentary based on historical data and analyst forecasts only using an unbiased methodology and our articles are not intended to be financial advice. It does not constitute a recommendation to buy or sell any stock, and does not take account of your objectives, or your financial situation. We aim to bring you long-term focused analysis driven by fundamental data. Note that our analysis may not factor in the latest price-sensitive company announcements or qualitative material. Simply Wall St has no position in any stocks mentioned.
About NZSE:FRW
Freightways Group
Provides express package and business mail, and information management services in New Zealand, Australia, and internationally.
Proven track record average dividend payer.
Similar Companies
Market Insights

Advertisement
Community Narratives
Kodiak AI - a potential 100 bagger opportunity?
Fair Value US$14.00|41.9% undervalued
DA
Community Contributor
A Fair Price for a Great Business Facing Real Threats
Fair Value US$383.06|14.1% undervalued
IM
Community Contributor
AXON And Shopify Integration Will Unlock Global Mobile Advertising
Fair Value US$613.59|1.3% undervalued
AN
Based on Analyst Price Targets