- New Zealand
- /
- Telecom Services and Carriers
- /
- NZSE:SPK
Spark New Zealand (NZSE:SPK) stock falls 4.8% in past week as three-year earnings and shareholder returns continue downward trend


For many investors, the main point of stock picking is to generate higher returns than the overall market. But its virtually certain that sometimes you will buy stocks that fall short of the market average returns. Unfortunately, that's been the case for longer term Spark New Zealand Limited (NZSE:SPK) shareholders, since the share price is down 34% in the last three years, falling well short of the market decline of around 6.5%. And more recent buyers are having a tough time too, with a drop of 34% in the last year. Shareholders have had an even rougher run lately, with the share price down 24% in the last 90 days.
Given the past week has been tough on shareholders, let's investigate the fundamentals and see what we can learn.
Check out our latest analysis for Spark New Zealand
To quote Buffett, 'Ships will sail around the world but the Flat Earth Society will flourish. There will continue to be wide discrepancies between price and value in the marketplace...' One imperfect but simple way to consider how the market perception of a company has shifted is to compare the change in the earnings per share (EPS) with the share price movement.
During the three years that the share price fell, Spark New Zealand's earnings per share (EPS) dropped by 5.4% each year. This reduction in EPS is slower than the 13% annual reduction in the share price. So it seems the market was too confident about the business, in the past.
You can see below how EPS has changed over time (discover the exact values by clicking on the image).
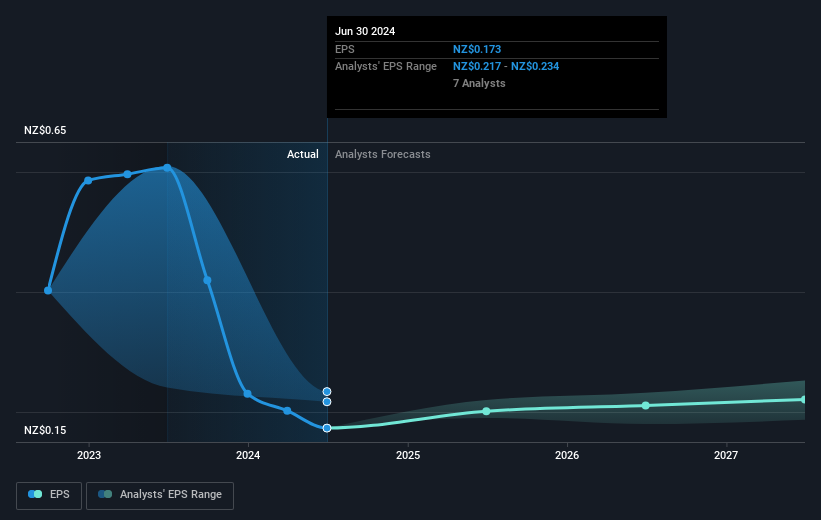
This free interactive report on Spark New Zealand's earnings, revenue and cash flow is a great place to start, if you want to investigate the stock further.
What About Dividends?
When looking at investment returns, it is important to consider the difference between total shareholder return (TSR) and share price return. Whereas the share price return only reflects the change in the share price, the TSR includes the value of dividends (assuming they were reinvested) and the benefit of any discounted capital raising or spin-off. Arguably, the TSR gives a more comprehensive picture of the return generated by a stock. In the case of Spark New Zealand, it has a TSR of -19% for the last 3 years. That exceeds its share price return that we previously mentioned. This is largely a result of its dividend payments!
A Different Perspective
While the broader market gained around 7.8% in the last year, Spark New Zealand shareholders lost 28% (even including dividends). Even the share prices of good stocks drop sometimes, but we want to see improvements in the fundamental metrics of a business, before getting too interested. Regrettably, last year's performance caps off a bad run, with the shareholders facing a total loss of 0.5% per year over five years. We realise that Baron Rothschild has said investors should "buy when there is blood on the streets", but we caution that investors should first be sure they are buying a high quality business. I find it very interesting to look at share price over the long term as a proxy for business performance. But to truly gain insight, we need to consider other information, too. For instance, we've identified 3 warning signs for Spark New Zealand (1 is potentially serious) that you should be aware of.
For those who like to find winning investments this free list of undervalued companies with recent insider purchasing, could be just the ticket.
Please note, the market returns quoted in this article reflect the market weighted average returns of stocks that currently trade on New Zealander exchanges.
If you're looking to trade Spark New Zealand, open an account with the lowest-cost platform trusted by professionals, Interactive Brokers.
With clients in over 200 countries and territories, and access to 160 markets, IBKR lets you trade stocks, options, futures, forex, bonds and funds from a single integrated account.
Enjoy no hidden fees, no account minimums, and FX conversion rates as low as 0.03%, far better than what most brokers offer.
Sponsored ContentNew: Manage All Your Stock Portfolios in One Place
We've created the ultimate portfolio companion for stock investors, and it's free.
• Connect an unlimited number of Portfolios and see your total in one currency
• Be alerted to new Warning Signs or Risks via email or mobile
• Track the Fair Value of your stocks
Have feedback on this article? Concerned about the content? Get in touch with us directly. Alternatively, email editorial-team (at) simplywallst.com.
This article by Simply Wall St is general in nature. We provide commentary based on historical data and analyst forecasts only using an unbiased methodology and our articles are not intended to be financial advice. It does not constitute a recommendation to buy or sell any stock, and does not take account of your objectives, or your financial situation. We aim to bring you long-term focused analysis driven by fundamental data. Note that our analysis may not factor in the latest price-sensitive company announcements or qualitative material. Simply Wall St has no position in any stocks mentioned.
About NZSE:SPK
Spark New Zealand
Provides telecommunications and digital services in New Zealand.
Average dividend payer slight.

