- New Zealand
- /
- Telecom Services and Carriers
- /
- NZSE:SPK
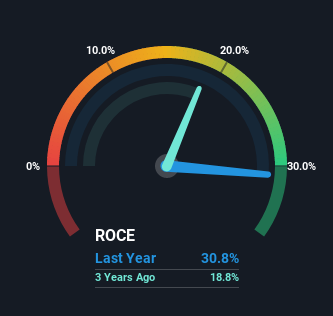
Returns on Capital Paint A Bright Future For Spark New Zealand (NZSE:SPK)

What trends should we look for it we want to identify stocks that can multiply in value over the long term? One common approach is to try and find a company with returns on capital employed (ROCE) that are increasing, in conjunction with a growing amount of capital employed. Basically this means that a company has profitable initiatives that it can continue to reinvest in, which is a trait of a compounding machine. With that in mind, the ROCE of Spark New Zealand (NZSE:SPK) looks great, so lets see what the trend can tell us.
Return On Capital Employed (ROCE): What Is It?
Just to clarify if you're unsure, ROCE is a metric for evaluating how much pre-tax income (in percentage terms) a company earns on the capital invested in its business. To calculate this metric for Spark New Zealand, this is the formula:
Return on Capital Employed = Earnings Before Interest and Tax (EBIT) ÷ (Total Assets - Current Liabilities)
0.31 = NZ$1.2b ÷ (NZ$4.6b - NZ$687m) (Based on the trailing twelve months to December 2022).
Therefore, Spark New Zealand has an ROCE of 31%. That's a fantastic return and not only that, it outpaces the average of 6.4% earned by companies in a similar industry.
View our latest analysis for Spark New Zealand
Above you can see how the current ROCE for Spark New Zealand compares to its prior returns on capital, but there's only so much you can tell from the past. If you'd like, you can check out the forecasts from the analysts covering Spark New Zealand here for free.
SWOT Analysis for Spark New Zealand
- Earnings growth over the past year exceeded the industry.
- Debt is not viewed as a risk.
- Dividend is low compared to the top 25% of dividend payers in the Telecom market.
- Current share price is above our estimate of fair value.
- SPK's financial characteristics indicate limited near-term opportunities for shareholders.
- Dividends are not covered by cash flow.
- Annual earnings are forecast to decline for the next 3 years.
What Can We Tell From Spark New Zealand's ROCE Trend?
Investors would be pleased with what's happening at Spark New Zealand. The data shows that returns on capital have increased substantially over the last five years to 31%. The amount of capital employed has increased too, by 48%. So we're very much inspired by what we're seeing at Spark New Zealand thanks to its ability to profitably reinvest capital.
One more thing to note, Spark New Zealand has decreased current liabilities to 15% of total assets over this period, which effectively reduces the amount of funding from suppliers or short-term creditors. So this improvement in ROCE has come from the business' underlying economics, which is great to see.
What We Can Learn From Spark New Zealand's ROCE
To sum it up, Spark New Zealand has proven it can reinvest in the business and generate higher returns on that capital employed, which is terrific. And a remarkable 104% total return over the last five years tells us that investors are expecting more good things to come in the future. So given the stock has proven it has promising trends, it's worth researching the company further to see if these trends are likely to persist.
On a final note, we found 3 warning signs for Spark New Zealand (2 are significant) you should be aware of.
If you'd like to see other companies earning high returns, check out our free list of companies earning high returns with solid balance sheets here.
Mobile Infrastructure for Defense and Disaster
The next wave in robotics isn't humanoid. Its fully autonomous towers delivering 5G, ISR, and radar in under 30 minutes, anywhere.
Get the investor briefing before the next round of contracts
Sponsored On Behalf of CiTechNew: Manage All Your Stock Portfolios in One Place
We've created the ultimate portfolio companion for stock investors, and it's free.
• Connect an unlimited number of Portfolios and see your total in one currency
• Be alerted to new Warning Signs or Risks via email or mobile
• Track the Fair Value of your stocks
Have feedback on this article? Concerned about the content? Get in touch with us directly. Alternatively, email editorial-team (at) simplywallst.com.
This article by Simply Wall St is general in nature. We provide commentary based on historical data and analyst forecasts only using an unbiased methodology and our articles are not intended to be financial advice. It does not constitute a recommendation to buy or sell any stock, and does not take account of your objectives, or your financial situation. We aim to bring you long-term focused analysis driven by fundamental data. Note that our analysis may not factor in the latest price-sensitive company announcements or qualitative material. Simply Wall St has no position in any stocks mentioned.
About NZSE:SPK
Spark New Zealand
Provides telecommunications and digital services in New Zealand.
Adequate balance sheet average dividend payer.
Similar Companies
Market Insights

Weekly Picks

THE KINGDOM OF BROWN GOODS: WHY MGPI IS BEING CRUSHED BY INVENTORY & PRIMED FOR RESURRECTION


Why Vertical Aerospace (NYSE: EVTL) is Worth Possibly Over 13x its Current Price


The Quiet Giant That Became AI’s Power Grid
Recently Updated Narratives


A tech powerhouse quietly powering the world’s AI infrastructure.


Keppel DC REIT (SGX: AJBU) is a resilient gem in the data center space.
Why Vertical Aerospace (NYSE: EVTL) is Worth Possibly Over 13x its Current Price
Popular Narratives

MicroVision will explode future revenue by 380.37% with a vision towards success


Crazy Undervalued 42 Baggers Silver Play (Active & Running Mine)


