- New Zealand
- /
- Biotech
- /
- NZSE:PEB
Did You Participate In Any Of Pacific Edge's (NZSE:PEB) Incredible 434% Return?

Active investing isn't easy, but for those that do it, the aim is to find the best companies to buy, and to profit handsomely. When you find (and hold) a big winner, you can markedly improve your finances. For example, Pacific Edge Limited (NZSE:PEB) has generated a beautiful 400% return in just a single year. On top of that, the share price is up 11% in about a quarter. But this could be related to the strong market, which is up 6.2% in the last three months. Also impressive, the stock is up 82% over three years, making long term shareholders happy, too.
View our latest analysis for Pacific Edge
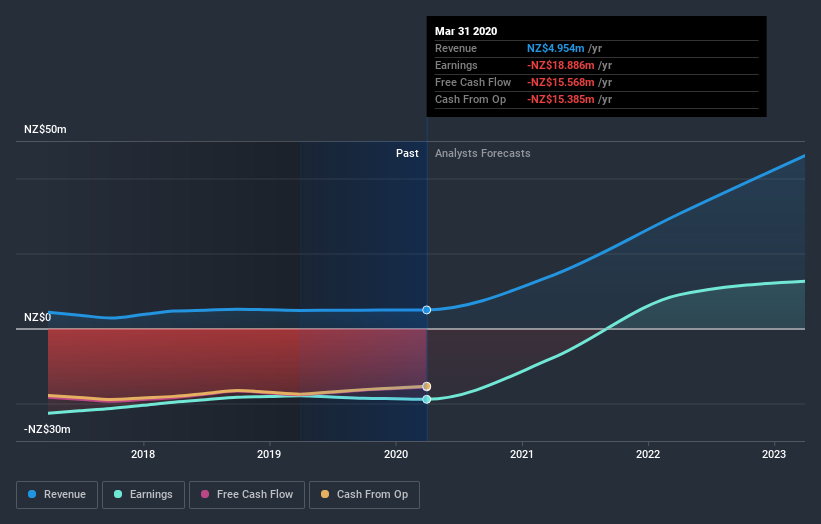
Because Pacific Edge made a loss in the last twelve months, we think the market is probably more focussed on revenue and revenue growth, at least for now. Generally speaking, companies without profits are expected to grow revenue every year, and at a good clip. That's because fast revenue growth can be easily extrapolated to forecast profits, often of considerable size.
In the last year Pacific Edge saw its revenue grow by 3.0%. That's not great considering the company is losing money. So it's truly surprising that the share price rocketed 400% in a single year. We're happy that investors have made money, but we can't help questioning whether the rise is sustainable. It just goes to show that big money can be made if you buy the right stock early.
The graphic below depicts how earnings and revenue have changed over time (unveil the exact values by clicking on the image).

We consider it positive that insiders have made significant purchases in the last year. Even so, future earnings will be far more important to whether current shareholders make money. This free report showing analyst forecasts should help you form a view on Pacific Edge
What about the Total Shareholder Return (TSR)?
We'd be remiss not to mention the difference between Pacific Edge's total shareholder return (TSR) and its share price return. Arguably the TSR is a more complete return calculation because it accounts for the value of dividends (as if they were reinvested), along with the hypothetical value of any discounted capital that have been offered to shareholders. Pacific Edge hasn't been paying dividends, but its TSR of 434% exceeds its share price return of 400%, implying it has either spun-off a business, or raised capital at a discount; thereby providing additional value to shareholders.
A Different Perspective
It's nice to see that Pacific Edge shareholders have received a total shareholder return of 434% over the last year. That's better than the annualised return of 12% over half a decade, implying that the company is doing better recently. Given the share price momentum remains strong, it might be worth taking a closer look at the stock, lest you miss an opportunity. It's always interesting to track share price performance over the longer term. But to understand Pacific Edge better, we need to consider many other factors. Case in point: We've spotted 2 warning signs for Pacific Edge you should be aware of.
Pacific Edge is not the only stock insiders are buying. So take a peek at this free list of growing companies with insider buying.
Please note, the market returns quoted in this article reflect the market weighted average returns of stocks that currently trade on NZ exchanges.
If you decide to trade Pacific Edge, use the lowest-cost* platform that is rated #1 Overall by Barron’s, Interactive Brokers. Trade stocks, options, futures, forex, bonds and funds on 135 markets, all from a single integrated account. Promoted
New: Manage All Your Stock Portfolios in One Place
We've created the ultimate portfolio companion for stock investors, and it's free.
• Connect an unlimited number of Portfolios and see your total in one currency
• Be alerted to new Warning Signs or Risks via email or mobile
• Track the Fair Value of your stocks
This article by Simply Wall St is general in nature. It does not constitute a recommendation to buy or sell any stock, and does not take account of your objectives, or your financial situation. We aim to bring you long-term focused analysis driven by fundamental data. Note that our analysis may not factor in the latest price-sensitive company announcements or qualitative material. Simply Wall St has no position in any stocks mentioned.
*Interactive Brokers Rated Lowest Cost Broker by StockBrokers.com Annual Online Review 2020
Have feedback on this article? Concerned about the content? Get in touch with us directly. Alternatively, email editorial-team@simplywallst.com.
About NZSE:PEB
Pacific Edge
A cancer diagnostics company, researches, develops, and commercializes diagnostic and prognostic tools for the early detection and management of cancers in New Zealand, the United States, and internationally.
Excellent balance sheet low.
Similar Companies
Market Insights
Community Narratives


