- New Zealand
- /
- Healthcare Services
- /
- NZSE:RYM
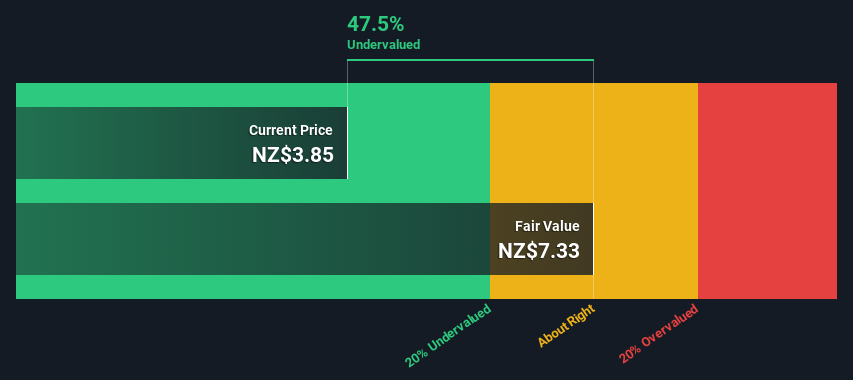
Are Investors Undervaluing Ryman Healthcare Limited (NZSE:RYM) By 47%?


Key Insights
- Using the 2 Stage Free Cash Flow to Equity, Ryman Healthcare fair value estimate is NZ$7.33
- Ryman Healthcare is estimated to be 47% undervalued based on current share price of NZ$3.85
- The NZ$5.96 analyst price target for RYM is 19% less than our estimate of fair value
In this article we are going to estimate the intrinsic value of Ryman Healthcare Limited (NZSE:RYM) by taking the expected future cash flows and discounting them to today's value. This will be done using the Discounted Cash Flow (DCF) model. Don't get put off by the jargon, the math behind it is actually quite straightforward.
Companies can be valued in a lot of ways, so we would point out that a DCF is not perfect for every situation. If you still have some burning questions about this type of valuation, take a look at the Simply Wall St analysis model.
See our latest analysis for Ryman Healthcare
The Method
We use what is known as a 2-stage model, which simply means we have two different periods of growth rates for the company's cash flows. Generally the first stage is higher growth, and the second stage is a lower growth phase. To start off with, we need to estimate the next ten years of cash flows. Where possible we use analyst estimates, but when these aren't available we extrapolate the previous free cash flow (FCF) from the last estimate or reported value. We assume companies with shrinking free cash flow will slow their rate of shrinkage, and that companies with growing free cash flow will see their growth rate slow, over this period. We do this to reflect that growth tends to slow more in the early years than it does in later years.
Generally we assume that a dollar today is more valuable than a dollar in the future, so we need to discount the sum of these future cash flows to arrive at a present value estimate:
10-year free cash flow (FCF) forecast
| 2025 | 2026 | 2027 | 2028 | 2029 | 2030 | 2031 | 2032 | 2033 | 2034 | |
| Levered FCF (NZ$, Millions) | -NZ$251.0m | NZ$331.0m | NZ$112.0m | NZ$350.0m | NZ$324.0m | NZ$310.5m | NZ$303.9m | NZ$301.8m | NZ$302.8m | NZ$305.9m |
| Growth Rate Estimate Source | Analyst x1 | Analyst x1 | Analyst x1 | Analyst x1 | Analyst x1 | Est @ -4.17% | Est @ -2.12% | Est @ -0.68% | Est @ 0.32% | Est @ 1.03% |
| Present Value (NZ$, Millions) Discounted @ 7.2% | -NZ$234 | NZ$288 | NZ$91.0 | NZ$265 | NZ$229 | NZ$205 | NZ$187 | NZ$174 | NZ$163 | NZ$153 |
("Est" = FCF growth rate estimated by Simply Wall St)
Present Value of 10-year Cash Flow (PVCF) = NZ$1.5b
After calculating the present value of future cash flows in the initial 10-year period, we need to calculate the Terminal Value, which accounts for all future cash flows beyond the first stage. The Gordon Growth formula is used to calculate Terminal Value at a future annual growth rate equal to the 5-year average of the 10-year government bond yield of 2.7%. We discount the terminal cash flows to today's value at a cost of equity of 7.2%.
Terminal Value (TV)= FCF2034 × (1 + g) ÷ (r – g) = NZ$306m× (1 + 2.7%) ÷ (7.2%– 2.7%) = NZ$7.0b
Present Value of Terminal Value (PVTV)= TV / (1 + r)10= NZ$7.0b÷ ( 1 + 7.2%)10= NZ$3.5b
The total value, or equity value, is then the sum of the present value of the future cash flows, which in this case is NZ$5.0b. To get the intrinsic value per share, we divide this by the total number of shares outstanding. Relative to the current share price of NZ$3.9, the company appears quite undervalued at a 47% discount to where the stock price trades currently. The assumptions in any calculation have a big impact on the valuation, so it is better to view this as a rough estimate, not precise down to the last cent.
Important Assumptions
Now the most important inputs to a discounted cash flow are the discount rate, and of course, the actual cash flows. If you don't agree with these result, have a go at the calculation yourself and play with the assumptions. The DCF also does not consider the possible cyclicality of an industry, or a company's future capital requirements, so it does not give a full picture of a company's potential performance. Given that we are looking at Ryman Healthcare as potential shareholders, the cost of equity is used as the discount rate, rather than the cost of capital (or weighted average cost of capital, WACC) which accounts for debt. In this calculation we've used 7.2%, which is based on a levered beta of 0.976. Beta is a measure of a stock's volatility, compared to the market as a whole. We get our beta from the industry average beta of globally comparable companies, with an imposed limit between 0.8 and 2.0, which is a reasonable range for a stable business.
SWOT Analysis for Ryman Healthcare
- Debt is well covered by earnings and cashflows.
- Earnings declined over the past year.
- Annual earnings are forecast to grow faster than the New Zealander market.
- Trading below our estimate of fair value by more than 20%.
- Revenue is forecast to grow slower than 20% per year.
Looking Ahead:
Valuation is only one side of the coin in terms of building your investment thesis, and it ideally won't be the sole piece of analysis you scrutinize for a company. It's not possible to obtain a foolproof valuation with a DCF model. Instead the best use for a DCF model is to test certain assumptions and theories to see if they would lead to the company being undervalued or overvalued. For instance, if the terminal value growth rate is adjusted slightly, it can dramatically alter the overall result. What is the reason for the share price sitting below the intrinsic value? For Ryman Healthcare, we've put together three further aspects you should consider:
- Risks: You should be aware of the 3 warning signs for Ryman Healthcare we've uncovered before considering an investment in the company.
- Future Earnings: How does RYM's growth rate compare to its peers and the wider market? Dig deeper into the analyst consensus number for the upcoming years by interacting with our free analyst growth expectation chart.
- Other High Quality Alternatives: Do you like a good all-rounder? Explore our interactive list of high quality stocks to get an idea of what else is out there you may be missing!
PS. Simply Wall St updates its DCF calculation for every New Zealander stock every day, so if you want to find the intrinsic value of any other stock just search here.
If you're looking to trade Ryman Healthcare, open an account with the lowest-cost platform trusted by professionals, Interactive Brokers.
With clients in over 200 countries and territories, and access to 160 markets, IBKR lets you trade stocks, options, futures, forex, bonds and funds from a single integrated account.
Enjoy no hidden fees, no account minimums, and FX conversion rates as low as 0.03%, far better than what most brokers offer.
Sponsored ContentNew: AI Stock Screener & Alerts
Our new AI Stock Screener scans the market every day to uncover opportunities.
• Dividend Powerhouses (3%+ Yield)
• Undervalued Small Caps with Insider Buying
• High growth Tech and AI Companies
Or build your own from over 50 metrics.
Have feedback on this article? Concerned about the content? Get in touch with us directly. Alternatively, email editorial-team (at) simplywallst.com.
This article by Simply Wall St is general in nature. We provide commentary based on historical data and analyst forecasts only using an unbiased methodology and our articles are not intended to be financial advice. It does not constitute a recommendation to buy or sell any stock, and does not take account of your objectives, or your financial situation. We aim to bring you long-term focused analysis driven by fundamental data. Note that our analysis may not factor in the latest price-sensitive company announcements or qualitative material. Simply Wall St has no position in any stocks mentioned.
Have feedback on this article? Concerned about the content? Get in touch with us directly. Alternatively, email editorial-team@simplywallst.com
About NZSE:RYM
Ryman Healthcare
Develops, owns, and operates integrated retirement villages, rest homes, and hospitals for the elderly people in New Zealand and Australia.
Reasonable growth potential and fair value.

