
Advertisement
Warren Buffett famously said, 'Volatility is far from synonymous with risk.' It's only natural to consider a company's balance sheet when you examine how risky it is, since debt is often involved when a business collapses. We note that Fletcher Building Limited (NZSE:FBU) does have debt on its balance sheet. But the more important question is: how much risk is that debt creating?
When Is Debt A Problem?
Debt assists a business until the business has trouble paying it off, either with new capital or with free cash flow. Part and parcel of capitalism is the process of 'creative destruction' where failed businesses are mercilessly liquidated by their bankers. However, a more common (but still painful) scenario is that it has to raise new equity capital at a low price, thus permanently diluting shareholders. Having said that, the most common situation is where a company manages its debt reasonably well - and to its own advantage. The first thing to do when considering how much debt a business uses is to look at its cash and debt together.
See our latest analysis for Fletcher Building
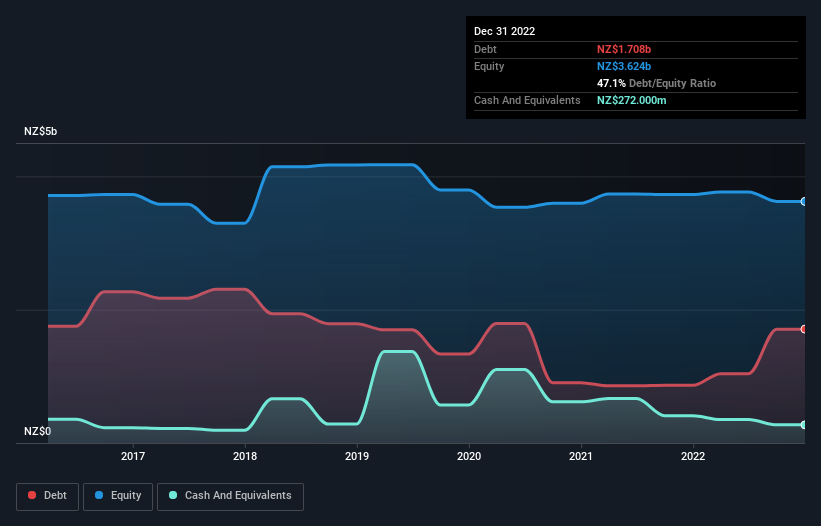
How Much Debt Does Fletcher Building Carry?
You can click the graphic below for the historical numbers, but it shows that as of December 2022 Fletcher Building had NZ$1.71b of debt, an increase on NZ$866.0m, over one year. However, because it has a cash reserve of NZ$272.0m, its net debt is less, at about NZ$1.44b.
A Look At Fletcher Building's Liabilities
The latest balance sheet data shows that Fletcher Building had liabilities of NZ$2.02b due within a year, and liabilities of NZ$3.15b falling due after that. Offsetting this, it had NZ$272.0m in cash and NZ$1.34b in receivables that were due within 12 months. So its liabilities outweigh the sum of its cash and (near-term) receivables by NZ$3.56b.
This deficit is considerable relative to its market capitalization of NZ$3.80b, so it does suggest shareholders should keep an eye on Fletcher Building's use of debt. This suggests shareholders would be heavily diluted if the company needed to shore up its balance sheet in a hurry.
In order to size up a company's debt relative to its earnings, we calculate its net debt divided by its earnings before interest, tax, depreciation, and amortization (EBITDA) and its earnings before interest and tax (EBIT) divided by its interest expense (its interest cover). This way, we consider both the absolute quantum of the debt, as well as the interest rates paid on it.
Fletcher Building's net debt is sitting at a very reasonable 1.6 times its EBITDA, while its EBIT covered its interest expense just 6.7 times last year. While that doesn't worry us too much, it does suggest the interest payments are somewhat of a burden. Also good is that Fletcher Building grew its EBIT at 15% over the last year, further increasing its ability to manage debt. When analysing debt levels, the balance sheet is the obvious place to start. But ultimately the future profitability of the business will decide if Fletcher Building can strengthen its balance sheet over time. So if you're focused on the future you can check out this free report showing analyst profit forecasts.
Finally, while the tax-man may adore accounting profits, lenders only accept cold hard cash. So we clearly need to look at whether that EBIT is leading to corresponding free cash flow. Looking at the most recent three years, Fletcher Building recorded free cash flow of 43% of its EBIT, which is weaker than we'd expect. That weak cash conversion makes it more difficult to handle indebtedness.
Our View
Fletcher Building's level of total liabilities and conversion of EBIT to free cash flow definitely weigh on it, in our esteem. But it seems to be able to grow its EBIT without much trouble. Looking at all the angles mentioned above, it does seem to us that Fletcher Building is a somewhat risky investment as a result of its debt. Not all risk is bad, as it can boost share price returns if it pays off, but this debt risk is worth keeping in mind. The balance sheet is clearly the area to focus on when you are analysing debt. But ultimately, every company can contain risks that exist outside of the balance sheet. To that end, you should learn about the 3 warning signs we've spotted with Fletcher Building (including 1 which makes us a bit uncomfortable) .
When all is said and done, sometimes its easier to focus on companies that don't even need debt. Readers can access a list of growth stocks with zero net debt 100% free, right now.
New: AI Stock Screener & Alerts
Our new AI Stock Screener scans the market every day to uncover opportunities.
• Dividend Powerhouses (3%+ Yield)
• Undervalued Small Caps with Insider Buying
• High growth Tech and AI Companies
Or build your own from over 50 metrics.
Have feedback on this article? Concerned about the content? Get in touch with us directly. Alternatively, email editorial-team (at) simplywallst.com.
This article by Simply Wall St is general in nature. We provide commentary based on historical data and analyst forecasts only using an unbiased methodology and our articles are not intended to be financial advice. It does not constitute a recommendation to buy or sell any stock, and does not take account of your objectives, or your financial situation. We aim to bring you long-term focused analysis driven by fundamental data. Note that our analysis may not factor in the latest price-sensitive company announcements or qualitative material. Simply Wall St has no position in any stocks mentioned.
About NZSE:FBU
Fletcher Building
Manufactures and distributes building products in New Zealand, Australia, and internationally.
Undervalued with adequate balance sheet.
Similar Companies
Market Insights

Advertisement
Community Narratives
MINISO's fair value is projected at 26.69 with an anticipated PE ratio shift of 20x
Fair Value US$24.03|11.4% undervalued
BE
Community Contributor
Procter & Gamble: A Dividend Giant Facing Slowing Growth
Fair Value US$119.81|23.5% overvalued
AN
Community Contributor
Eli Lilly's Future Growth Driven by Tirzepatide and Favorable Market Conditions
Fair Value US$1.19k|14.0% undervalued
EA
Community Contributor