Advertisement
Does Kitron’s Recent 72% Rally in 2025 Still Leave Room for Growth?

Simply Wall St
Reviewed by Bailey Pemberton
If you are eyeing Kitron stock and wondering whether now is a good time to buy, hold, or rethink your position, you are not alone. Kitron has been a standout on the market, posting an impressive 72.1% return year-to-date and a staggering 107.5% gain over the past year. Even looking further back, Kitron has outperformed with a 233.8% return over three years and 282.3% over five years. While there was a slight dip of 0.3% over the past week, the share price climbed 5.0% over the last 30 days, which may signal renewed investor confidence and potential for further growth.
Much of this upward momentum can be linked to ongoing market shifts, including increasing demand for electronics manufacturing services and a broad focus on efficient supply chains. These factors have helped boost Kitron's long-term prospects and may have shifted how investors are perceiving its risk and reward profile.
Of course, excitement is one thing, but you are probably here for the numbers and looking for a grounded sense of value. Kitron carries a valuation score of 2 out of 6 by our checks, meaning it is considered undervalued in two distinct ways. This is worth noting, but not a guarantee of future performance. So, what goes into this score, and which valuation tools really matter when deciding if Kitron still has room to run or if its rally might be overextended? Let's break down the main valuation approaches next and see if they capture the full picture, or if there is an even smarter way to assess what Kitron is really worth.
Kitron scores just 2/6 on our valuation checks. See what other red flags we found in the full valuation breakdown.
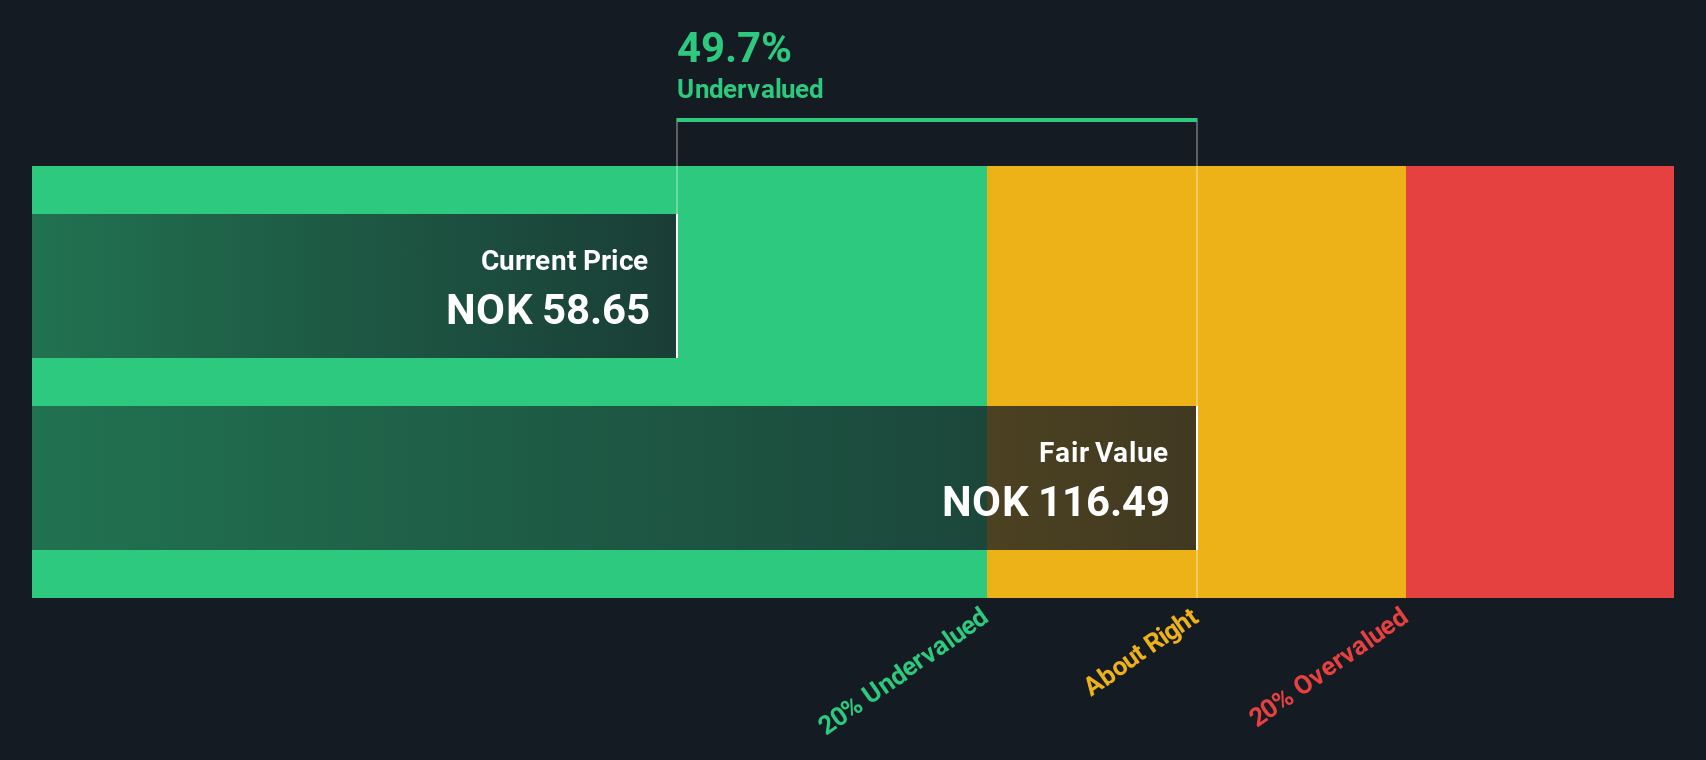
Approach 1: Kitron Discounted Cash Flow (DCF) Analysis
A Discounted Cash Flow (DCF) model works by projecting a company's expected future cash flows and then discounting those back to their value today, providing an estimate of what the business is actually worth now based on these future earnings.
For Kitron, the most recent reported Free Cash Flow (FCF) stands at €36.99 million. Analyst estimates cover the next several years, indicating FCF growth to an estimated €49.25 million by 2027. Beyond 2027, further projections are extrapolated, with figures rising to above €63 million by 2035, according to Simply Wall St. This model uses a "2 Stage Free Cash Flow to Equity" approach, accounting for changing growth rates over time.
The DCF model calculates Kitron's intrinsic value at €56.88 per share. Compared to the current market price, this implies the stock is about 4.3% overvalued, which is a relatively minor discrepancy that falls within a fair value range.
Result: ABOUT RIGHT
Simply Wall St performs a valuation analysis on every stock in the world every day (check out Kitron's valuation analysis). We show the entire calculation in full. You can track the result in your watchlist or portfolio and be alerted when this changes.
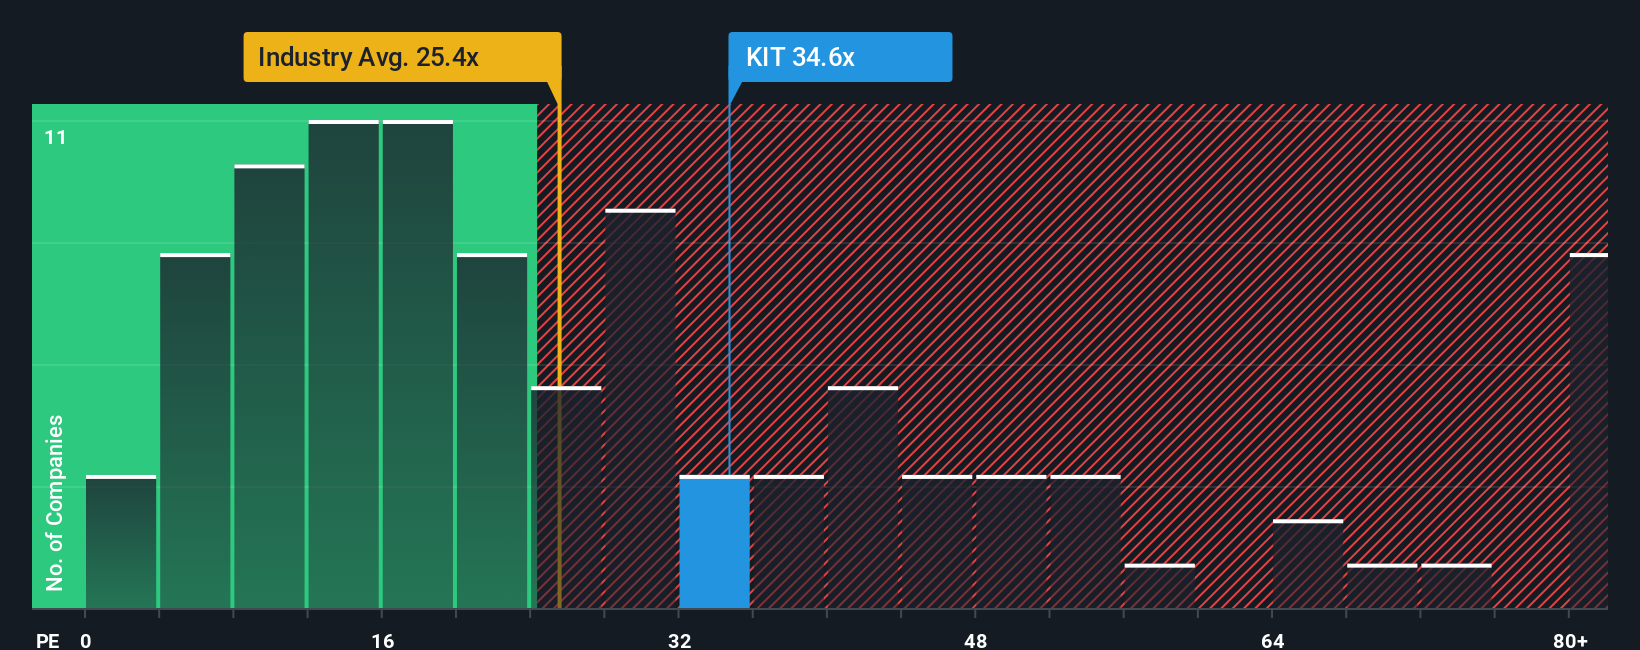
Approach 2: Kitron Price vs Earnings (PE)
The Price-to-Earnings (PE) ratio is a core valuation tool for companies that are steadily profitable, such as Kitron. It helps investors assess how much the market is paying for each unit of reported earnings, making it especially useful for comparing companies within the same sector or industry that have positive net income.
Growth prospects and perceived risks have a big influence on what a fair or “normal” PE ratio should look like. High-growth, lower-risk companies often justify a higher PE, while riskier or slower-growing firms tend to see lower ratios. For Kitron, the current PE ratio sits at 35.2x. Compared to the broader electronic industry average of 27.4x and peer group’s average of 37.3x, Kitron trades at a modest premium to its sector but slightly below the immediate peer group.
Beyond these benchmarks, Simply Wall St calculates a proprietary “Fair Ratio” for each company. In Kitron’s case, the Fair Ratio is 35.6x. This Fair Ratio adjusts for factors such as the company’s future earnings growth, profit margins, risk profile, industry, and market capitalization. By using this tailored approach, investors can get a more accurate sense of intrinsic value than by simply comparing Kitron to the generic industry average or closest rivals.
With Kitron’s actual PE ratio just a fraction below its Fair Ratio, the valuation appears well-aligned with fundamentals.
Result: ABOUT RIGHT
PE ratios tell one story, but what if the real opportunity lies elsewhere? Discover companies where insiders are betting big on explosive growth.
Upgrade Your Decision Making: Choose your Kitron Narrative
Earlier we mentioned that there is an even better way to understand valuation, so let's introduce you to Narratives. A Narrative is a clear, easy-to-understand story that describes your perspective on Kitron by linking the company’s unique strategy and outlook to a specific financial forecast and a fair value estimate.
Instead of just relying on raw valuation numbers, Narratives let you connect the dots between what’s happening in Kitron’s business, such as order growth or tariff changes, and the numbers you expect to see for future revenue, margins, and share price.
On Simply Wall St’s platform, Narratives are accessible to anyone within the Community page, where millions of investors share their structured takes on what will drive Kitron’s value. Narratives make decision making easier. They help you see not only what the numbers are, but why those numbers make sense, and whether Kitron’s Fair Value (based on your assumptions) is above or below today’s Price.
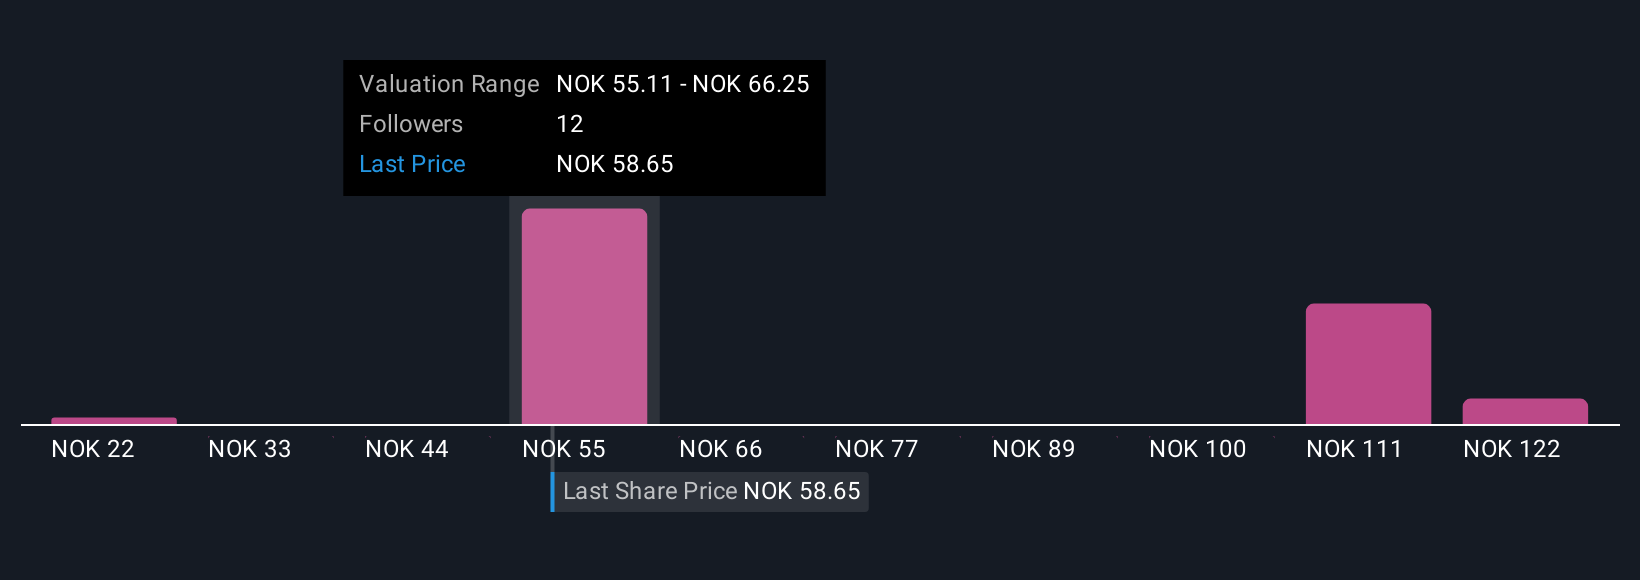
As news or earnings updates arrive, Narratives are updated in real time, letting you react confidently as the story changes. For example, one investor might see Kitron’s fair value as high as NOK65.0 thanks to defense order growth, while another sees risk from margin pressure and sets a much lower value, allowing you to compare and decide where you stand.
Do you think there's more to the story for Kitron? Create your own Narrative to let the Community know!
This article by Simply Wall St is general in nature. We provide commentary based on historical data and analyst forecasts only using an unbiased methodology and our articles are not intended to be financial advice. It does not constitute a recommendation to buy or sell any stock, and does not take account of your objectives, or your financial situation. We aim to bring you long-term focused analysis driven by fundamental data. Note that our analysis may not factor in the latest price-sensitive company announcements or qualitative material. Simply Wall St has no position in any stocks mentioned.
Valuation is complex, but we're here to simplify it.
Discover if Kitron might be undervalued or overvalued with our detailed analysis, featuring fair value estimates, potential risks, dividends, insider trades, and its financial condition.
Access Free AnalysisHave feedback on this article? Concerned about the content? Get in touch with us directly. Alternatively, email editorial-team@simplywallst.com
About OB:KIT
Kitron
Operates as an electronics manufacturing services provider in Norway, Sweden, Denmark, Lithuania, Germany, Poland, the Czech Republic, India, China, Malaysia, and the United States.
High growth potential with excellent balance sheet.
Similar Companies
Market Insights

Advertisement
Community Narratives
A formidable player in AI and enterprise computing.
Fair Value US$210.00|12.2% overvalued
CO
Community Contributor
IREN's Bold Moves in Sustainable Bitcoin Mining & AI Data Centers
Fair Value US$72.52|17.1% undervalued
BL
Community Contributor
Cooling the Champions: The Aussie Tech Behind F1's Victories
Fair Value AU$12.40|38.7% undervalued
TR
Community Contributor