Returns On Capital Signal Tricky Times Ahead For Questback Group (OB:QUEST)

If we want to find a stock that could multiply over the long term, what are the underlying trends we should look for? Firstly, we'd want to identify a growing return on capital employed (ROCE) and then alongside that, an ever-increasing base of capital employed. Basically this means that a company has profitable initiatives that it can continue to reinvest in, which is a trait of a compounding machine. However, after investigating Questback Group (OB:QUEST), we don't think it's current trends fit the mold of a multi-bagger.
Return On Capital Employed (ROCE): What Is It?
Just to clarify if you're unsure, ROCE is a metric for evaluating how much pre-tax income (in percentage terms) a company earns on the capital invested in its business. The formula for this calculation on Questback Group is:
Return on Capital Employed = Earnings Before Interest and Tax (EBIT) ÷ (Total Assets - Current Liabilities)
0.086 = kr27m ÷ (kr439m - kr125m) (Based on the trailing twelve months to December 2021).
Therefore, Questback Group has an ROCE of 8.6%. On its own that's a low return on capital but it's in line with the industry's average returns of 9.3%.
Our analysis indicates that QUEST is potentially undervalued!
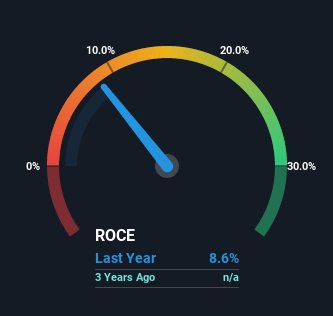
Historical performance is a great place to start when researching a stock so above you can see the gauge for Questback Group's ROCE against it's prior returns. If you're interested in investigating Questback Group's past further, check out this free graph of past earnings, revenue and cash flow.
What Does the ROCE Trend For Questback Group Tell Us?
In terms of Questback Group's historical ROCE movements, the trend isn't fantastic. To be more specific, ROCE has fallen from 46% over the last two years. Given the business is employing more capital while revenue has slipped, this is a bit concerning. This could mean that the business is losing its competitive advantage or market share, because while more money is being put into ventures, it's actually producing a lower return - "less bang for their buck" per se.
On a related note, Questback Group has decreased its current liabilities to 28% of total assets. That could partly explain why the ROCE has dropped. Effectively this means their suppliers or short-term creditors are funding less of the business, which reduces some elements of risk. Some would claim this reduces the business' efficiency at generating ROCE since it is now funding more of the operations with its own money.
The Key Takeaway
We're a bit apprehensive about Questback Group because despite more capital being deployed in the business, returns on that capital and sales have both fallen. Investors haven't taken kindly to these developments, since the stock has declined 60% from where it was year ago. With underlying trends that aren't great in these areas, we'd consider looking elsewhere.
If you'd like to know more about Questback Group, we've spotted 4 warning signs, and 3 of them are a bit concerning.
For those who like to invest in solid companies, check out this free list of companies with solid balance sheets and high returns on equity.
The New Payments ETF Is Live on NASDAQ:
Money is moving to real-time rails, and a newly listed ETF now gives investors direct exposure. Fast settlement. Institutional custody. Simple access.
Explore how this launch could reshape portfolios
Sponsored ContentValuation is complex, but we're here to simplify it.
Discover if Questback Group might be undervalued or overvalued with our detailed analysis, featuring fair value estimates, potential risks, dividends, insider trades, and its financial condition.
Access Free AnalysisHave feedback on this article? Concerned about the content? Get in touch with us directly. Alternatively, email editorial-team (at) simplywallst.com.
This article by Simply Wall St is general in nature. We provide commentary based on historical data and analyst forecasts only using an unbiased methodology and our articles are not intended to be financial advice. It does not constitute a recommendation to buy or sell any stock, and does not take account of your objectives, or your financial situation. We aim to bring you long-term focused analysis driven by fundamental data. Note that our analysis may not factor in the latest price-sensitive company announcements or qualitative material. Simply Wall St has no position in any stocks mentioned.
About OB:QUEST
Questback Group
Questback Group AS operates a platform for conducting employee and customer experience surveys in Norway and internationally.
Good value with weak fundamentals.
Market Insights

Weekly Picks

Early mover in a fast growing industry. Likely to experience share price volatility as they scale


A case for CA$31.80 (undiluted), aka 8,616% upside from CA$0.37 (an 86 bagger!).


Moderation and Stabilisation: HOLD: Fair Price based on a 4-year Cycle is $12.08
Recently Updated Narratives

Amazon: Why the World’s Biggest Platform Still Runs on Invisible Economics

Sunrun Stock: When the Energy Transition Collides With the Cost of Capital

Salesforce Stock: AI-Fueled Growth Is Real — But Can Margins Stay This Strong?
Popular Narratives


MicroVision will explode future revenue by 380.37% with a vision towards success


Crazy Undervalued 42 Baggers Silver Play (Active & Running Mine)


